Article

Curation and Analysis of a Saccharomyces cerevisiae Genome-Scale Metabolic Model for Predicting Production of Sensory Impact Molecules under Enological Conditions

by
William T. Scott, Jr.
1,2,
Eddy J. Smid
2,
Richard A. Notebaart
2 and
David E. Block
1,3,*
1
Department of Chemical Engineering, University of California, One Shields Ave, Davis, CA 95616, USA
2
Food Microbiology, Wageningen University & Research, P.O. Box 17, 6700 AA Wageningen, The Netherlands
3
Department of Viticulture and Enology, University of California, One Shields Ave, Davis, CA 95616, USA
*
Author to whom correspondence should be addressed.
Processes 2020, 8(9), 1195; https://doi.org/10.3390/pr8091195
Submission received: 1 July 2020 / Revised: 31 August 2020 / Accepted: 15 September 2020 / Published: 21 September 2020
(This article belongs to the Special Issue Role of Yeast in Wine Fermentation Processes)

Abstract

:
One approach for elucidating strain-to-strain metabolic differences is the use of genome-scale metabolic models (GSMMs). To date GSMMs have not focused on the industrially important area of flavor production and, as such; do not cover all the pathways relevant to flavor formation in yeast. Moreover, current models for Saccharomyces cerevisiae generally focus on carbon-limited and/or aerobic systems, which is not pertinent to enological conditions. Here, we curate a GSMM (iWS902) to expand on the existing Ehrlich pathway and ester formation pathways central to aroma formation in industrial winemaking, in addition to the existing sulfur metabolism and medium-chain fatty acid (MCFA) pathways that also contribute to production of sensory impact molecules. After validating the model using experimental data, we predict key differences in metabolism for a strain (EC 1118) in two distinct growth conditions, including differences for aroma impact molecules such as acetic acid, tryptophol, and hydrogen sulfide. Additionally, we propose novel targets for metabolic engineering for aroma profile modifications employing flux variability analysis with the expanded GSMM. The model provides mechanistic insights into the key metabolic pathways underlying aroma formation during alcoholic fermentation and provides a potential framework to contribute to new strategies to optimize the aroma of wines.

1. Introduction

Saccharomyces cerevisiae is employed to produce many specialized metabolites for the beverage, food, cosmetics, and pharmaceutical industries [1]. When producing alcoholic beverages, in particular wines, sensorial properties are of major importance to quality. Therefore, it is beneficial for the wine industry to be able to systematically optimize the production of key aroma metabolites. However, in order to control flavor compound formation and optimize the quality of wine, a better understanding of the aroma formation during fermentation is essential. This is not a simple task, as the metabolic pathways leading to flavor and aroma impact molecules are complex and not fully understood. Despite the large amount of work using systems biology approaches to understand aroma production during fermentation, we are still only beginning to understand how metabolic changes impact aroma production [2,3]. Achieving a better understanding will allow more control over alcoholic beverage production.
When presented with a suitable substrate and processing conditions, S. cerevisiae generates a complex bouquet of aroma compounds during fermentation, including esters, higher (fusel) alcohols, and sulfur compounds. The most abundant of these volatile aroma compounds produced during fermentation are fusel alcohols which serve as precursors to volatile esters. The latter compounds add fruity aromas to wines [4]. The most significant of the fusel alcohols include 1-propanol, 3-methyl-1-butanol (isoamyl alcohol), 2-methyl-1-propanol (isobutanol), 2-methyl-1-butanol (active amyl alcohol), 2-phenylethanol, and 4-(2-hydroxyethyl) phenol (tyrosol) [5]. Volatile esters important to the sensory characteristics of wine include two groups: acetate esters, such as ethyl acetate (sweet aroma), isoamyl acetate (banana), and phenylethyl acetate (rose, flowery aroma); and medium chain fatty acid (MCFA) ethyl esters, such as ethyl octanoate (sour apple) and ethyl hexanoate (apple, anise) [6,7,8]. In contrast to most ester compounds, sulfur-containing compounds such as methionol and hydrogen sulfide produce undesirable cabbage or rotten-egg aromas [9]. Hydrogen sulfide produced during fermentation introduces the most prominent sulfur off-notes in wines [10]. Other sulfur compounds such as methanethiol, a volatile thiol, can also be responsible for producing undesirable flatulence-like aromas. Despite the interest in refining the aroma character of wines and other alcoholic beverages, the knowledge of yeast metabolism necessary to fully control production of aroma molecules has not yet been elucidated [8].
Adjusting environmental conditions such as temperature or changing initial nutrient concentrations can serve as a means of varying the production of yeast-derived aroma in alcoholic fermentation for a given strain to some degree. This approach, however, relies on a thorough understanding of the underlying metabolism of the organism. To gain this understanding, some studies have used systems biology approaches such as metabolomics, though most of these studies employed the laboratory strain S288C, which does not contain several genes present in wine and beer S. cerevisiae strains [11]. Although the fermentation environment significantly influences secondary metabolism, the response to the environment depends immensely on the yeast strain selected for fermentation [12,13,14]. When different commercial yeast strains are used and compared, strain specific differences in secondary metabolite composition in the fermented products can be observed, indicating metabolic and most likely genetic differences between strains [15,16,17]. For instance, the kinetics of volatile ester formation from various yeast strains was studied under varying amounts of initial nitrogen as well as different initial brix conditions [18,19]. However, most experimental studies that have investigated the impact of environmental changes on yeast fermentation of wines were restricted by the use of only a small number of industrially relevant strains or lacked investigation into the genomic and/or metabolic causes of fermentation behavior [16,20,21].
Genomics studies have focused on the role of genes in regulating aroma producing metabolic pathways where, for instance, they illustrated the effect of certain alcohol acyl transferases (AATs) on S. cerevisiae ester production [22,23,24]. There are two known alcohol acyl transferases—EEB1 and EHT1—that are responsible for the synthesis of fatty acid ethyl esters [25]. Moreover, Kruis et al. [24] showed that a third ethyl acetate-forming enzyme, ethanol acetyltransferase 1 (EAT1), contributes to ester production in S. cerevisiae. EAT1, in addition to facilitating the formation of ethyl acetate, can perform thioesterase and esterase reactions. Despite those studies being pivotal, it would add insight to the prospects of genetic engineering approaches to alter wine sensory characteristics if we could obtain a more comprehensive representation of metabolic behavior during wine fermentation that would include reactions such as these. In addition, studies have lacked a comprehensive investigation into the aforementioned classes of compounds simultaneously and holistically. Thus, a broader assessment of metabolic pathways in commercially relevant S. cerevisiae strains is required to fully elucidate the regulation of aroma compounds produced during fermentation [10].
One way to obtain insights into complex metabolic pathways is by metabolic modeling. More than two decades ago, the first flux balance analysis (FBA) models were used to analyze carbon flux and energy distribution in microbes [26,27,28]. This included some small network models for S. cerevisiae that focused on wine fermentations [29,30,31,32]. More recently, several genome-scale metabolic models (GSMMs) have been developed for yeast that show the potential of these simulations to predict the impact of genetic changes on cell phenotype [33,34,35,36,37]. In addition, Vargas et al. [38] applied a GSMM to study wine fermentation over time. While earlier metabolic modeling studies that focused on simulating yeast metabolism successfully predicted flux distributions, they were not genome scale representations of yeast metabolism (fewer than 100 reactions) [30,32,39], making it difficult to study individual fluxes that are likely related to overall aroma formation. Despite the increasingly expanded coverage of yeast metabolic network models over the last few years, all published GSMMs of yeast still contain a partial or incomplete representation of the formation of aroma impact molecules. More specifically, GSMMs up to this point have not included MCFA ester formation, as well as production of important sulfur-containing compounds such as dimethyl sulfide. Larger GSMMs have been used to simulate yeast fermentations, but studies applying them have mostly lacked exploration of enological fermentations where nitrogen was not the growth limiting nutrient and/or the system was not anaerobic [36,37,39]. Vargas et al. [38] did apply an earlier yeast GSMM model to dynamically model a wine fermentation, although their study did not cover aroma formation. While there have been at least 12 GSMMs for yeast released since the first one was published in 2003 by Förster et al. [33], the available GSMMs still lack a comprehensive coverage of essential metabolic pathways needed to investigate aroma formation during alcohol fermentation.
In this study, we present an expanded genome-scale metabolic model of S. cerevisiae to incorporate aroma forming pathways including parts of the Ehrlich pathway, pathways related to ester synthesis, and parts of the sulfur reduction pathways. A widely used published reconstruction of yeast metabolism referred to as iMM904 [40,41] was taken as a framework to incorporate known aroma forming reactions, as well as relevant chemical, non-enzymatic conversions and transport reactions. Our expanded GSMM was validated using published data from a study that employed a commercial wine yeast strain EC1118 under enological conditions (synthetic grape juice/must medium using an industrial wine strain and anaerobic fermentation) [30]. Furthermore, we applied the model to understand the underlying metabolic differences regarding aroma production under two different growth conditions. Here, we illustrate the advances and remaining limitations of this expanded GSMM to simulate metabolism and production of aroma impact molecules under enological conditions.

2. Materials and Methods

2.1. Model Curation and Development

A current model was evaluated as a base model for expansion, a widely adopted stoichiometric model of the S. cerevisiae metabolic network iMM904 [40,41]. The most recent GSMM, Yeast 8 [42], was also evaluated as a base model for this work. While predicted fluxes of primary metabolites with an expanded Yeast 8 model were similar to those using the iMM904 base model, prediction of secondary metabolites was far superior with the iMM904 base model (data not shown). Furthermore, Heavner and Price [43] concluded that yeast GSMM performance and predictions varies according to simulation environments and evaluation metrics. Thus, all subsequent work was performed using the expanded iMM904 model. iMM904 was expanded by incorporating more fusel alcohol production routes into the Ehrlich pathway, adding pathways for acetate and medium-chain fatty acid (MCFA) ester formation reactions, and expanding sulfur reduction pathways. An overview illustrating the key additions and modifications to the base model to construct the expanded model (iWS902) is represented in Figure 1 and Table 1, and comprehensive details are provided in the Supplementary Information Tables S1–S3. Uptake exchange reactions for the sugar, essential amino acids, and other nutrients were set according to measured flux values from a chemically defined medium during anaerobic nitrogen-limited fermentations found in the literature (Supplementary Table S1 from Quiros et al. [30]). No strictly anaerobic growth was predicted with flux balance analysis with this particular medium composition. Therefore, an extremely low O2 exchange flux of −0.01 mmol g DW−1 h−1 was assumed for our simulations. This is a reasonable assumption because Aceituno et al. demonstrated that a wine fermentation with less than 0.1 mmol O2 g DW−1 h−1 behaved anaerobically [31]. Using the approach suggested by Heavner et al. [44] for anaerobic conditions, we allowed unrestricted uptake of ergosterol, lanosterol, zymosterol, 14-demethyllanosterol, and oleate. In addition, pathways including the oxaloacetate-malate shuttle and glycerol dehydrogenase reaction were unrestricted as described by Sanchez et al. [45]. Heme A was also removed from the biomass equation because it is not used under anaerobic conditions. The biomass equation was adapted from a published nitrogen-limited biomass equation [38].

2.2. Flux Balance Analysis

FBA is a widely used approach for studying biochemical networks. This approach allows prediction of the flux of metabolites through the network [46,47]. It is a technique based on mass balances. For m metabolites and n reactions, a m × n stoichiometric matrix S can be formulated and, if we neglect the accumulation of metabolites (pseudo-steady-state assumption), a mass balance for all metabolites can be written as
S · v = 0
where v is the flux vector [mmol g DW−1 h−1]. Furthermore, upper and lower bounds for each flux can be included to define the reversibility of each reaction, as well as to account for experimental observations of extracellular metabolite fluxes (for example, nutrient utilization or product formation). Here, constraints on the exchange reactions of the amino acids and nutrients taken up from the medium are taken from those measured in Quiros et al. [30]. The uptake and secretion fluxes are expressed in mmol g DW−1 h−1 (note that a negative flux for an exchange reaction means uptake of the corresponding metabolite). In our study, we simulated two different growth conditions described by Quiros et al. [30] (both in chemostats at steady state using a defined medium with a glucose feed concentration of 280 g/L): (i) temperature of 16 °C with a growth rate, μ, of 0.1 h−1 (Case I) and (ii) temperature of 28 °C with a μ of 0.25 h−1 (Case II). In addition, we simulated Quiros et al. [30] (in chemostats at steady state using a defined medium with a glucose feed concentration of 240 g/L): (i) temperature of 16 °C with a growth rate, μ, of 0.1 h−1 (Case III) and (ii) temperature of 28 °C with a μ of 0.25 h−1 (Case IV) (results shown in Figure S1 of the Supplementary Material). In these studies, the growth rate was fixed by the dilution rate for each case, as the dilution rate is equal to the growth rate for a chemostat. Though not typical of grape juice that contains relatively equal concentrations of glucose and fructose, the defined medium used in this study used only glucose. Both cases had a yeast assimilable nitrogen level (YAN) of 220 mg/L in the chemostat feed. To assess the predictive power of the model, we performed FBA using only measured experimental consumption rates [30] to set constraints. Production rates for key metabolites were not constrained; therefore, predictions could be used to evaluate the predictive performance of our expanded GSMM. However, when assessing differences in predicted intracellular metabolic fluxes for the two cases, we also constrained secretion fluxes, in addition to the consumption rates, using data from Quiros et al. [30]. A more detailed overview of model constraints and conditions are represented in the Supplementary Material (Table S4).
Since metabolic models are usually highly underdetermined (there are many more reactions than metabolites), a minimized or maximized objective function is applied to the model to solve for all fluxes. Here, an optimization problem was solved to maximize growth rate (µ), a biologically relevant objective function, with linear programming as shown below
max μ   c T v ,      s . t .    S v = 0        L B v U B
where LB and UB are vectors containing the lower and upper bounds, respectively, for all of the fluxes in units of mmol g DW−1 h−1.

2.3. Flux Variability Analysis

Flux variability analysis (FVA) is a technique which identifies the allowable range of flux values through a given reaction by finding its maximum and minimum flux values for a given optimal (i.e., maximum) objective value [48]. This analysis method begins by finding the optimal value of the objective function, as specified in Equation (2), for a given set of constraints. The objective function is set for each reaction in the network and minimum and maximum flux values for each reaction are computed while using the constraints related to the optimal solution [49]. The FVA problem can be constructed as follows:
min / max z i = C i T v i ,    s . t .    S v = 0      L B v U B C T v λ Z 0
where v i is the flux value for each reaction, both maximum and minimum flux values of a reaction were calculated to determine the full range. Z 0 is the optimal (maximum) value calculated by FBA. λ , whose value can be between 0 and 1, is a parameter to govern whether the analysis is carried out at a suboptimal network state ( λ < 1 ) or at an optimal state ( λ = 1 ).
The range of a flux i (δi) is determined in Equation (4) as the difference between the maximum and the minimum value:
δ i = v m a x , i v m i n , i
For this analysis, we constrained the model using the same set of experimental uptake and secretion fluxes as in the FBA (see Section 2.2) (constrained case). Additionally, we performed another FVA where all substrate and production rates were unconstrained (unconstrained case). Since it is of interest in this study to maximize aroma production and the complexity of the aroma profile of wines, it is necessary to increase the flux of certain aroma compounds. It must be noted that FBA allows for optimization of a single flux. Therefore, this problem was resolved by adding an extra reaction to the network whereby the 1-propanol, 3-methyl-1-butanol, 2-methyl-1-propanol, 2-methyl-1-butanol 2-phenylethanol, indole-3-ethanol, and 4-(2-hydroxyethyl) phenol were lumped into a reaction using functions in Cobra Toolbox. Note: these lumped reactions were only added for the FVA. Subsequently, a transport reaction from the cytosolic lumped product to the same extracellular product was added. This allows for optimization of all seven fusel alcohols at the same time.

2.4. Computing Environment

Modeling was performed in MATLAB® 2018b (The MathWorks, Inc., Cambridge, MA, USA) using Cobra Toolbox version 3.0 [50,51,52] and implemented on a Windows 10 (Microsoft Corporation, Redmond, WA, USA) Intel® (Intel Corporation, Santa Clara, CA, USA) Core™ i7-7500 CPU @ 2.70 GHz–2.90 GHz processor. Git version 2.19. and curl version 7.61.1 were installed before cloning COBRA with Github and initializing COBRA in Matlab. The solver used for solving the linear and mixed integer problems was Gurobi version 9.0 (Gurobi Optimization, LLC, Beaverton, OR, USA). The GSMM was imported into MATLAB, as an SBML file, and curated using Cobra Toolbox. For network visualization, the model was exported into OmixTM version 1.9.34 (Omix Visualization GmbH & Co. KG, Lennestadt, Germany) [53] and Escher (The Regents of the University of California, Oakland, CA, USA) [54].

3. Results

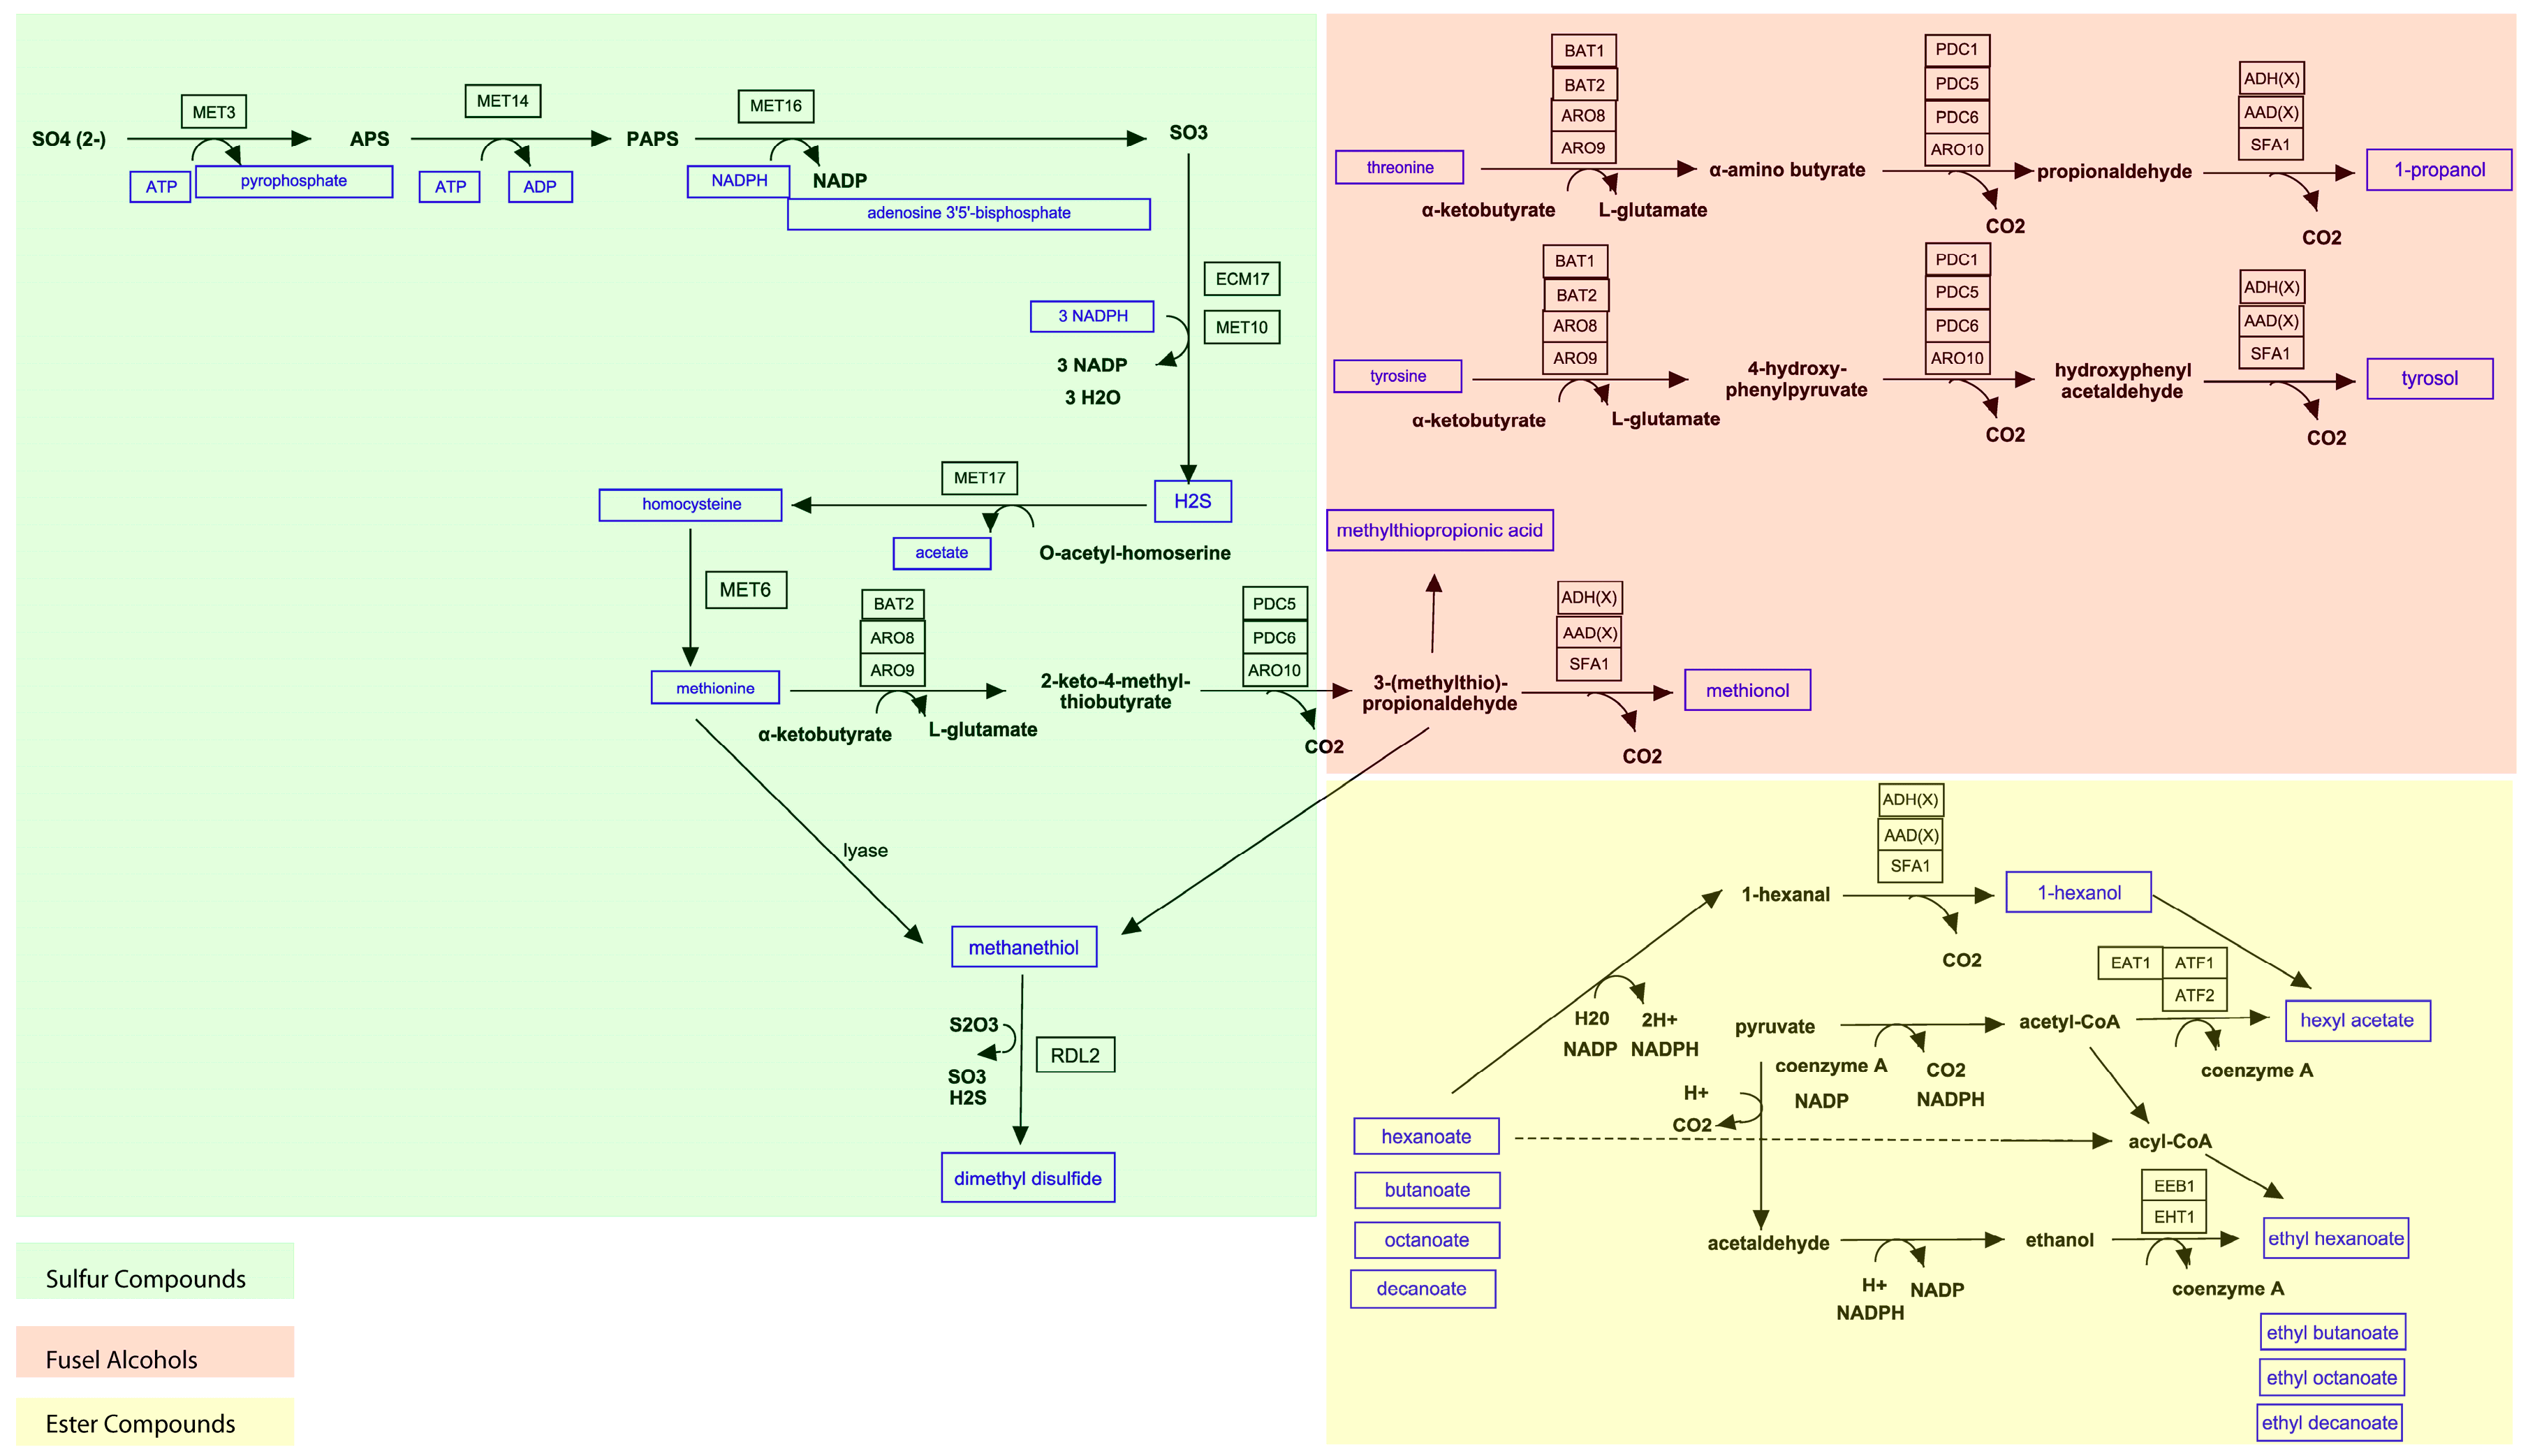
3.1. Coverage of Aroma Pathways in the Model (GSMM)

When examining current GSMMs, it becomes apparent that some essential aroma impact molecules are missing. Therefore, we addressed this deficiency through literature curation and pathway incorporation into an existing GSMM (see Figure 1 and Table 1 for details). The existing model we used contained five relevant (higher) alcohols and their respective esters, which are shown in Table 1. Higher alcohols, which form the highest concentrations of aroma impact molecules, are produced predominately via the Ehrlich pathway [10,55]. This three-step pathway (Figure 1) features (i) a transamination reaction between an amino acid and α-ketoglutarate, (ii) a decarboxylation reaction facilitated by several pyruvate decarboxylases where an α-keto acid is converted to a branched-chain aldehyde, and (iii) a reduction step catalyzed by alcohol dehydrogenases reducing the aldehyde to a higher alcohol [4,56]. Higher alcohols and their respective pathways that were added to the GSMM include 1-propanol, tyrosol, 1-hexanol, and methionol, which have aroma attributes ranging from sweet, floral, and fruity (tyrosol) to meaty and oniony (methionol).
Two different classes of esters, acetate esters and fatty acid ethyl esters, are formed depending on their use of acetyl-CoA or acyl-CoA, respectively (Figure 1). Acetate esters are compounds such as ethyl acetate, isoamyl acetate, isobutyl acetate, 2-methylbutyl acetate, hexyl acetate and 2-phenylethyl acetate. Many of these acetate esters are contained in existing GSMMs with the exception of hexyl acetate, which we added to our model. Members of the second class of esters, i.e., fatty acid ethyl esters, are formed from a reaction between a bonded CoA-MCFA and ethanol as illustrated (see Figure 1). Fatty acid ethyl esters include compounds such as ethyl butanoate, ethyl hexanoate, ethyl octanoate, and ethyl decanoate [57].
Sulfur-containing compounds are also formed during alcoholic fermentation. These compounds are diverse in character from simple thiols (e.g., methanethiol) to sulfides (e.g., hydrogen sulfide) to thioesters. Given that there is an extensive variety of sulfur-containing compounds that can arise during alcoholic fermentation and that many volatile sulfur pathways in yeast are still poorly understood [8], we mainly focused on the assimilation of sulfur and its links to amino acid metabolism. Sulfur compounds are produced by the sulfate-reduction sequence pathway where, by means of sulfate permease (SUL1 or SUL2), sulfate is taken up from the medium and reduced to sulfite, followed by further reduction to sulfide through MET5 and MET10, respectively [9,58]. Next, excess sulfide is either used to form hydrogen sulfide, which is excreted from the cell or becomes incorporated into the amino acid synthesis pathway. Sulfide combines with O-acetyl-homoserine to form homocysteine [5]. From here, methionine-γ-lyase can convert the reaction from methionine to a methanethiol, which can subsequently serve as a precursor to some thioesters and sulfides (Figure 1). We extended the coverage of known sulfur producing pathways in our GSMM by adding pathways for methionol, methionyl acetate, and dimethyl disulfide. The other parts of sulfur metabolism were already included in the GSMM.
In order to properly model metabolic impacts of aroma formation, we incorporated and added to the reconstruction known aroma forming reactions, as well as relevant chemical, non-enzymatic, conversions and transport reactions. In total, we integrated 58 reactions, 43 metabolites, and three enzyme-catalyzed reaction-associated genes involved in flavor formation into the base GSMM to form the newly expanded model iWS902. iWS902 contains eight compartments: cytosol, endoplasmic reticulum, extra organism, Golgi apparatus, mitochondria, nucleus, peroxisome, and vacuole. Also, iWS902 is annotated according to BiGG database convention (http://bigg.ucsd.edu/). A comprehensive table of reactions (enzyme commission number, reaction equation, etc.) (Table S3), their associated genes (Table S1), and metabolites (Minimum Information Required in the Annotation of Models (MIRIAM), composition, charge number, compartment, etc.) (Table S2) that were added to the model are shown in the Supplementary Material (Supplementary Tables S1–S3).

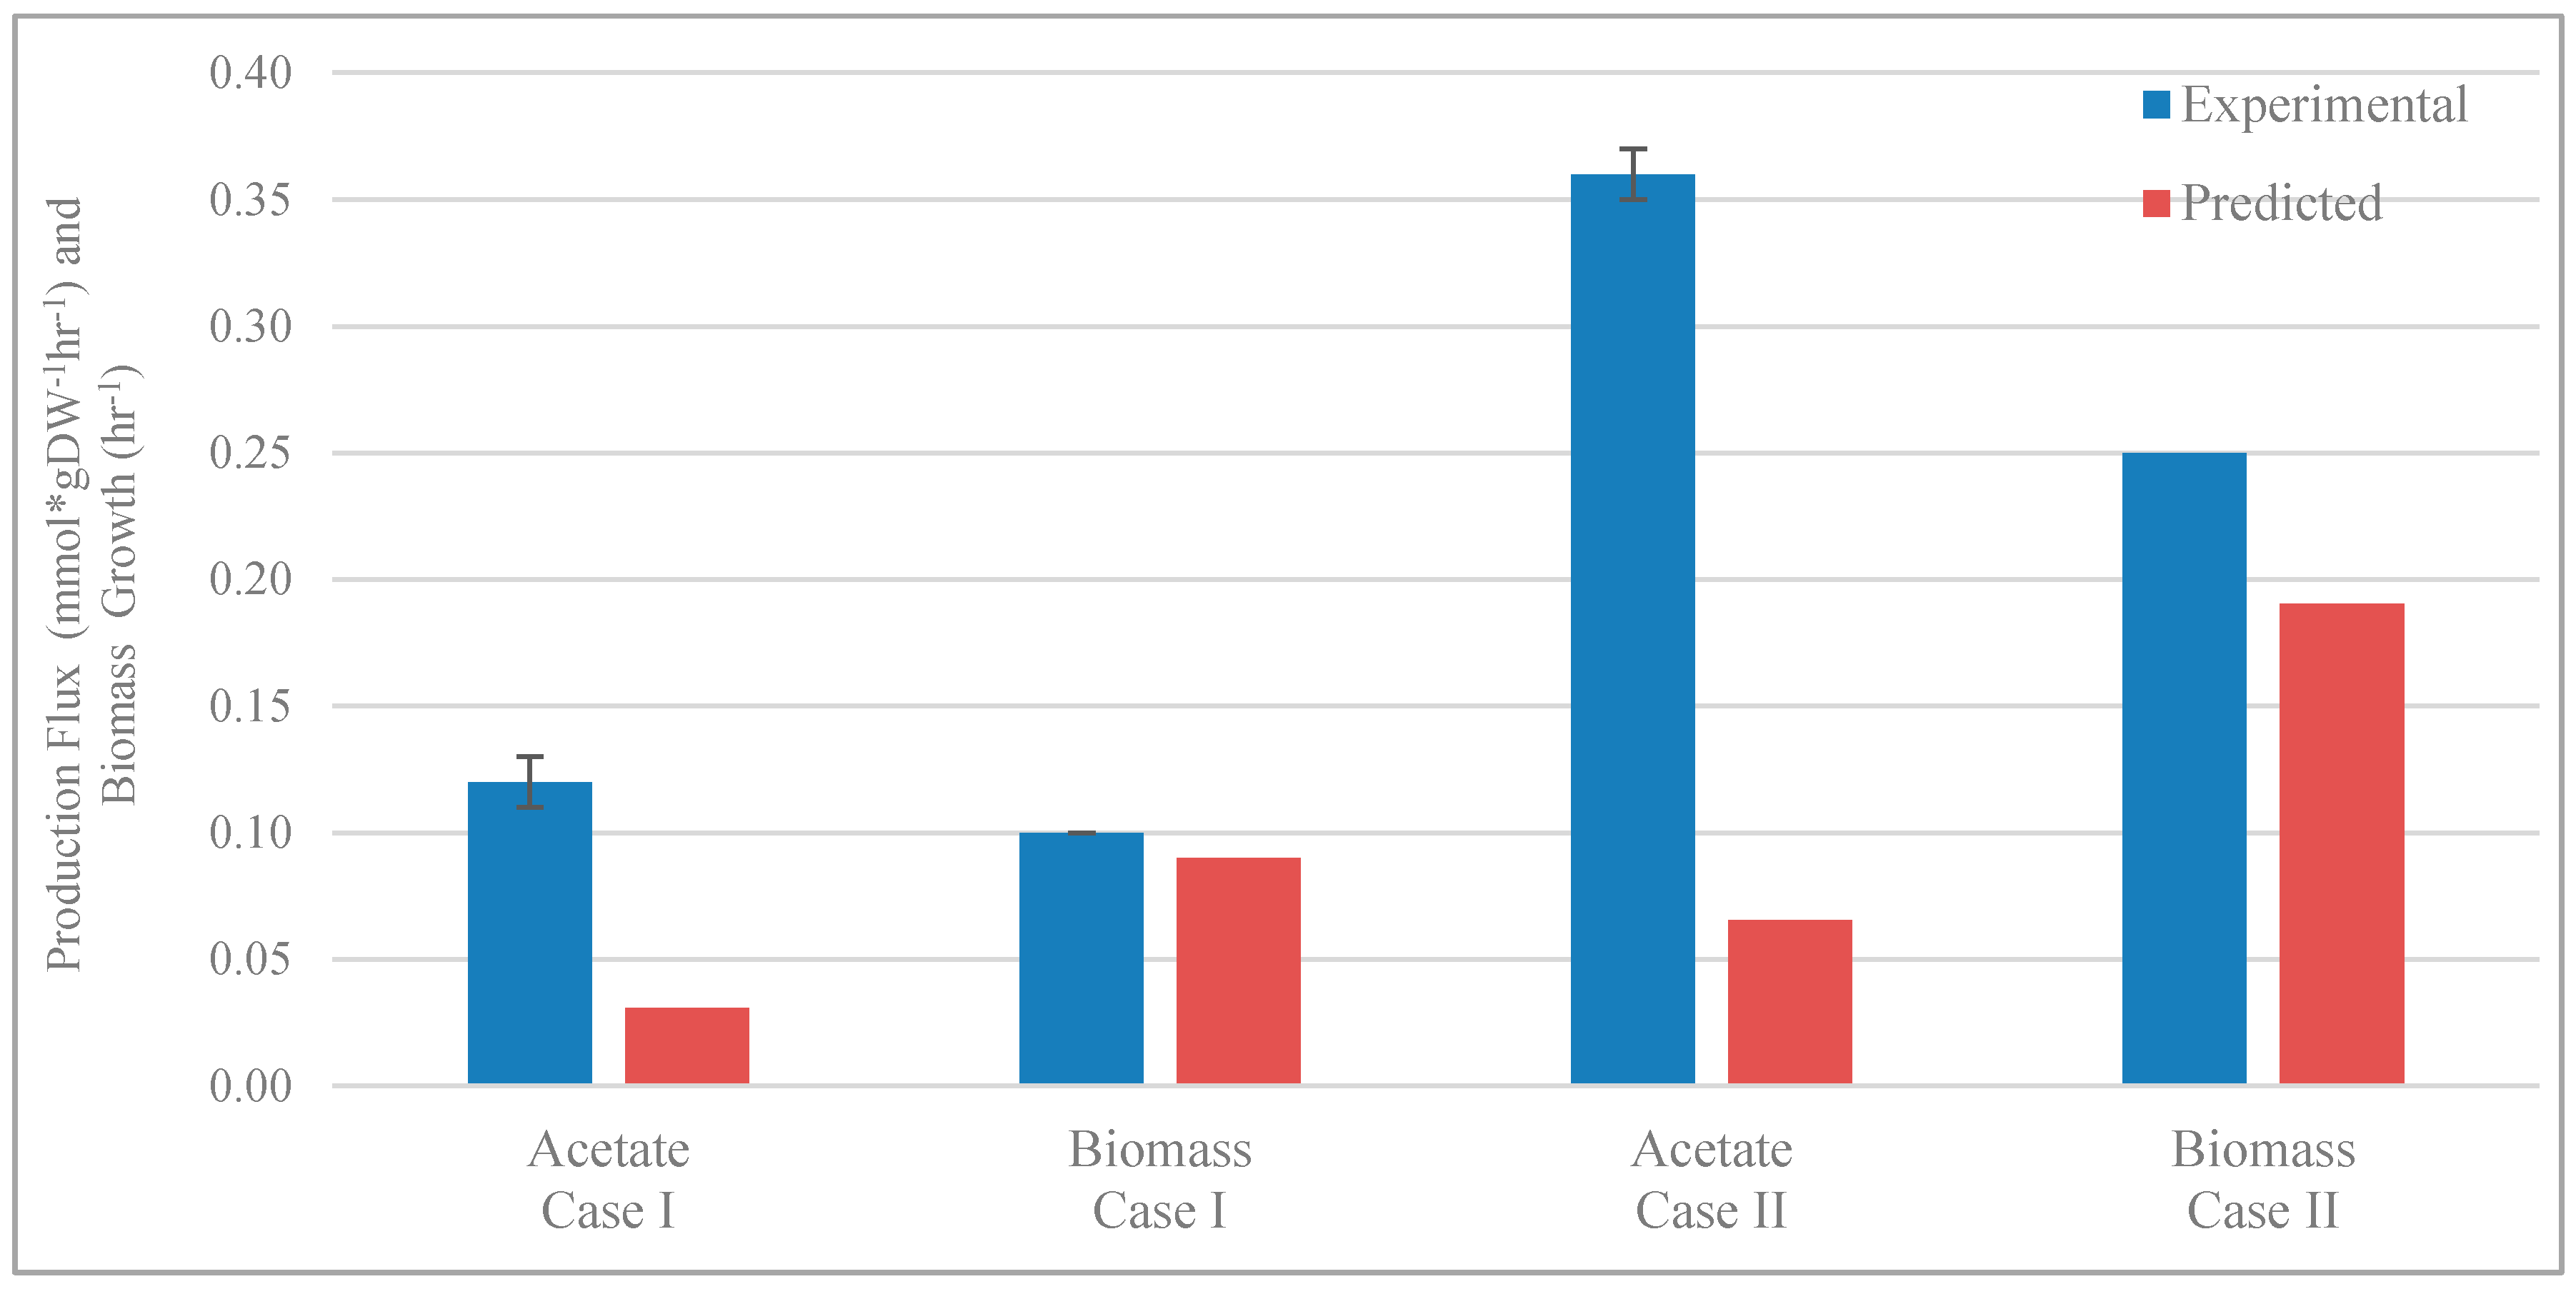
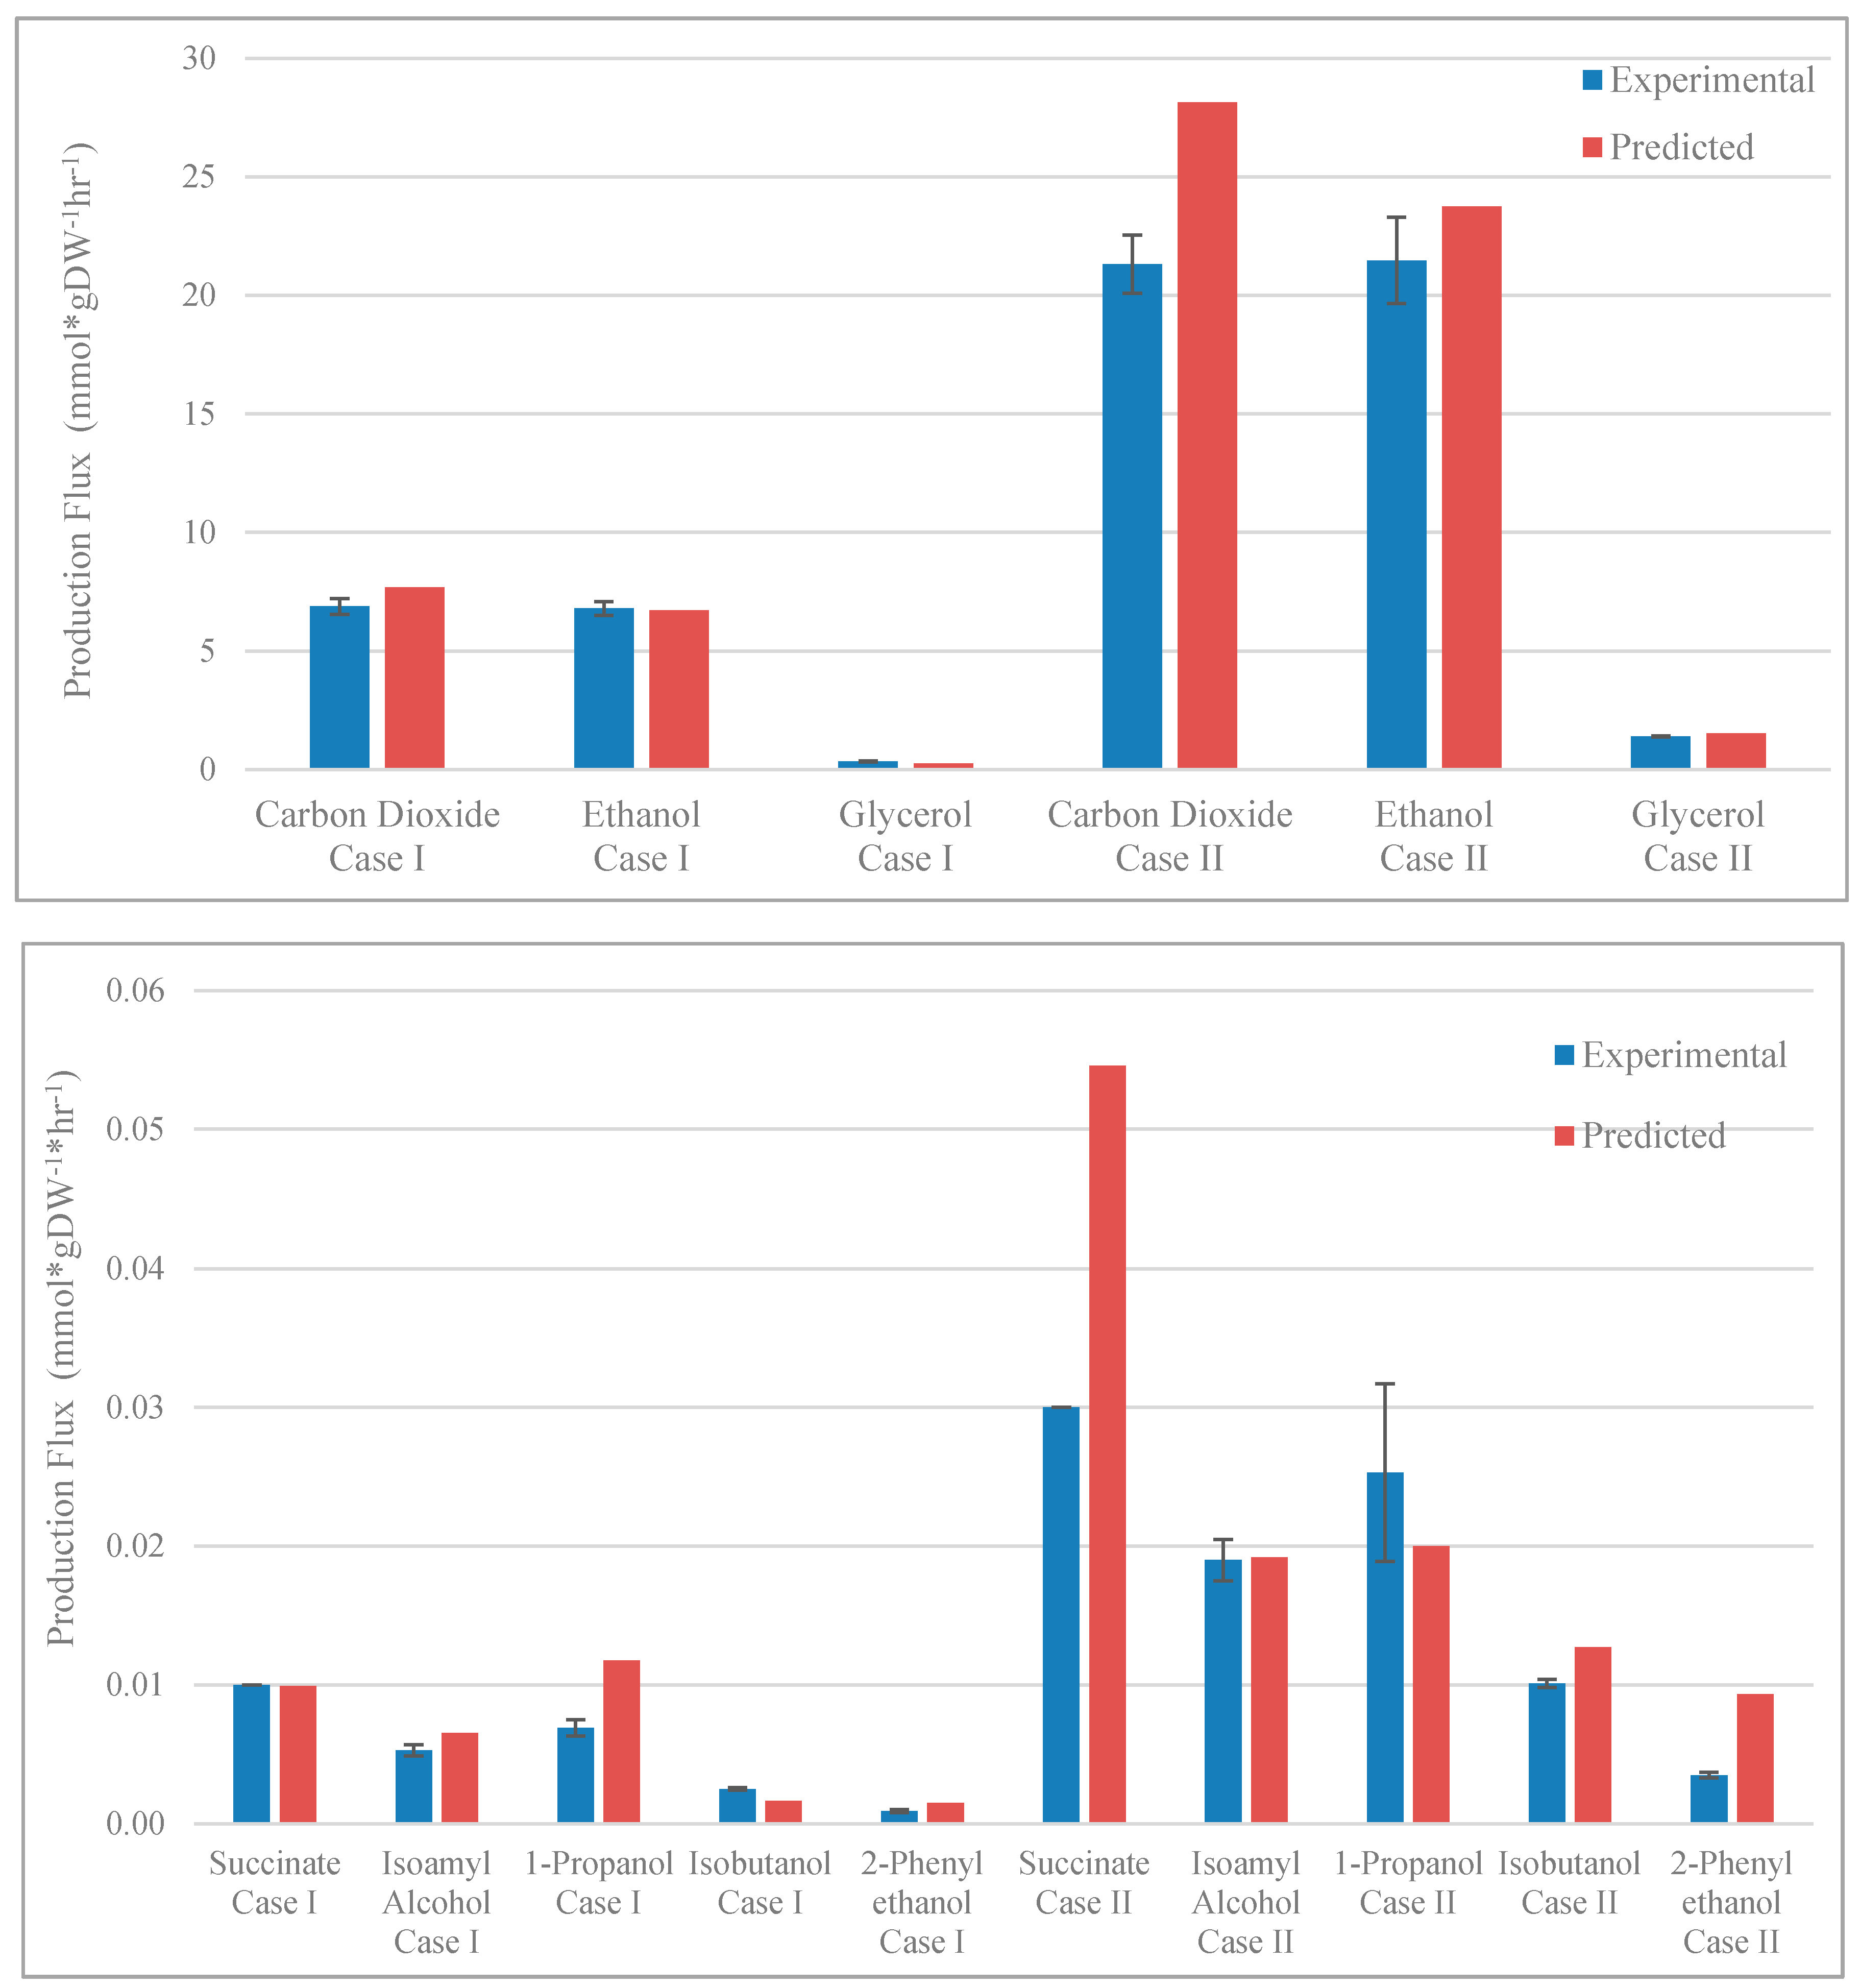
3.2. Validation of Model Predictions

FBA (see Section 2) was used to assess the predictive capability of our modified GSMM model to simulate yeast fermentation behavior under two relevant growth conditions for the industrially relevant strain EC1118 in a chemostat, Cases I and II as defined in the Section 2 (for more detail see Supplementary Table S4). These growth conditions likely mimic a stage of a wine fermentation corresponding to the end of exponential growth phase for each case. The use of a chemostat facilitated direct measurement of the growth and consumption/production rates of key metabolites as they are constant over time. Since the maximum rate of production of key volatile higher alcohols [59] and other aroma precursors occurs just at the onset of stationary phase as cells are leaving exponential phase, these data were chosen for evaluating model predictions of aroma and other compounds produced by the yeast.
GSMM predictions are shown with the experimental data for the two enological fermentation cases (Figure 2). Here it is illustrated that our model, using the set of constraints developed in this study, succeeded in predicting the formation of many key metabolites. Furthermore, our simulations predicted soundly for major metabolites as well as biomass growth in Case I while predicting somewhat less accurately for biomass growth in Case II and acetate formation for both cases. More specifically, the biomass growth rate was predicted to be 24% less than the experimentally determined biomass growth rate in Case II and 10% less than the experimentally determined biomass growth rate in Case I. Despite underestimating biomass growth, we were able to successfully predict metabolites formation for both cases. More specifically, ethanol, carbon dioxide, and glycerol were predicted well, while carbon dioxide production was predicted to be 29% higher than the experimental flux for Case II. The model predicted relatively successfully the formation of some metabolites including the production of volatile aroma metabolites. While for both cases the model predicted production of organic acids (succinate and lactate) close to experimental production rates, acetate production in both cases was significantly under-predicted. Applying FBA to our model, we effectively predicted the production rates of higher alcohols, particularly; 1-propanol, which was added to the GSMM, is predicted rather closely to experimental production rates for both conditions. Furthermore, the simulated production rates of other higher alcohols (3-methylbutanol (isoamyl alcohol), isobutanol, 2-phenyl ethanol, and 2-methyl-1-butanol) show considerable agreement with their experimental production rates for Case I, although there is a slight over prediction for many of these higher alcohols for Case II. GSMM predictions for Case III and Case IV are shown in Figure S1 of the Supplementary Material.

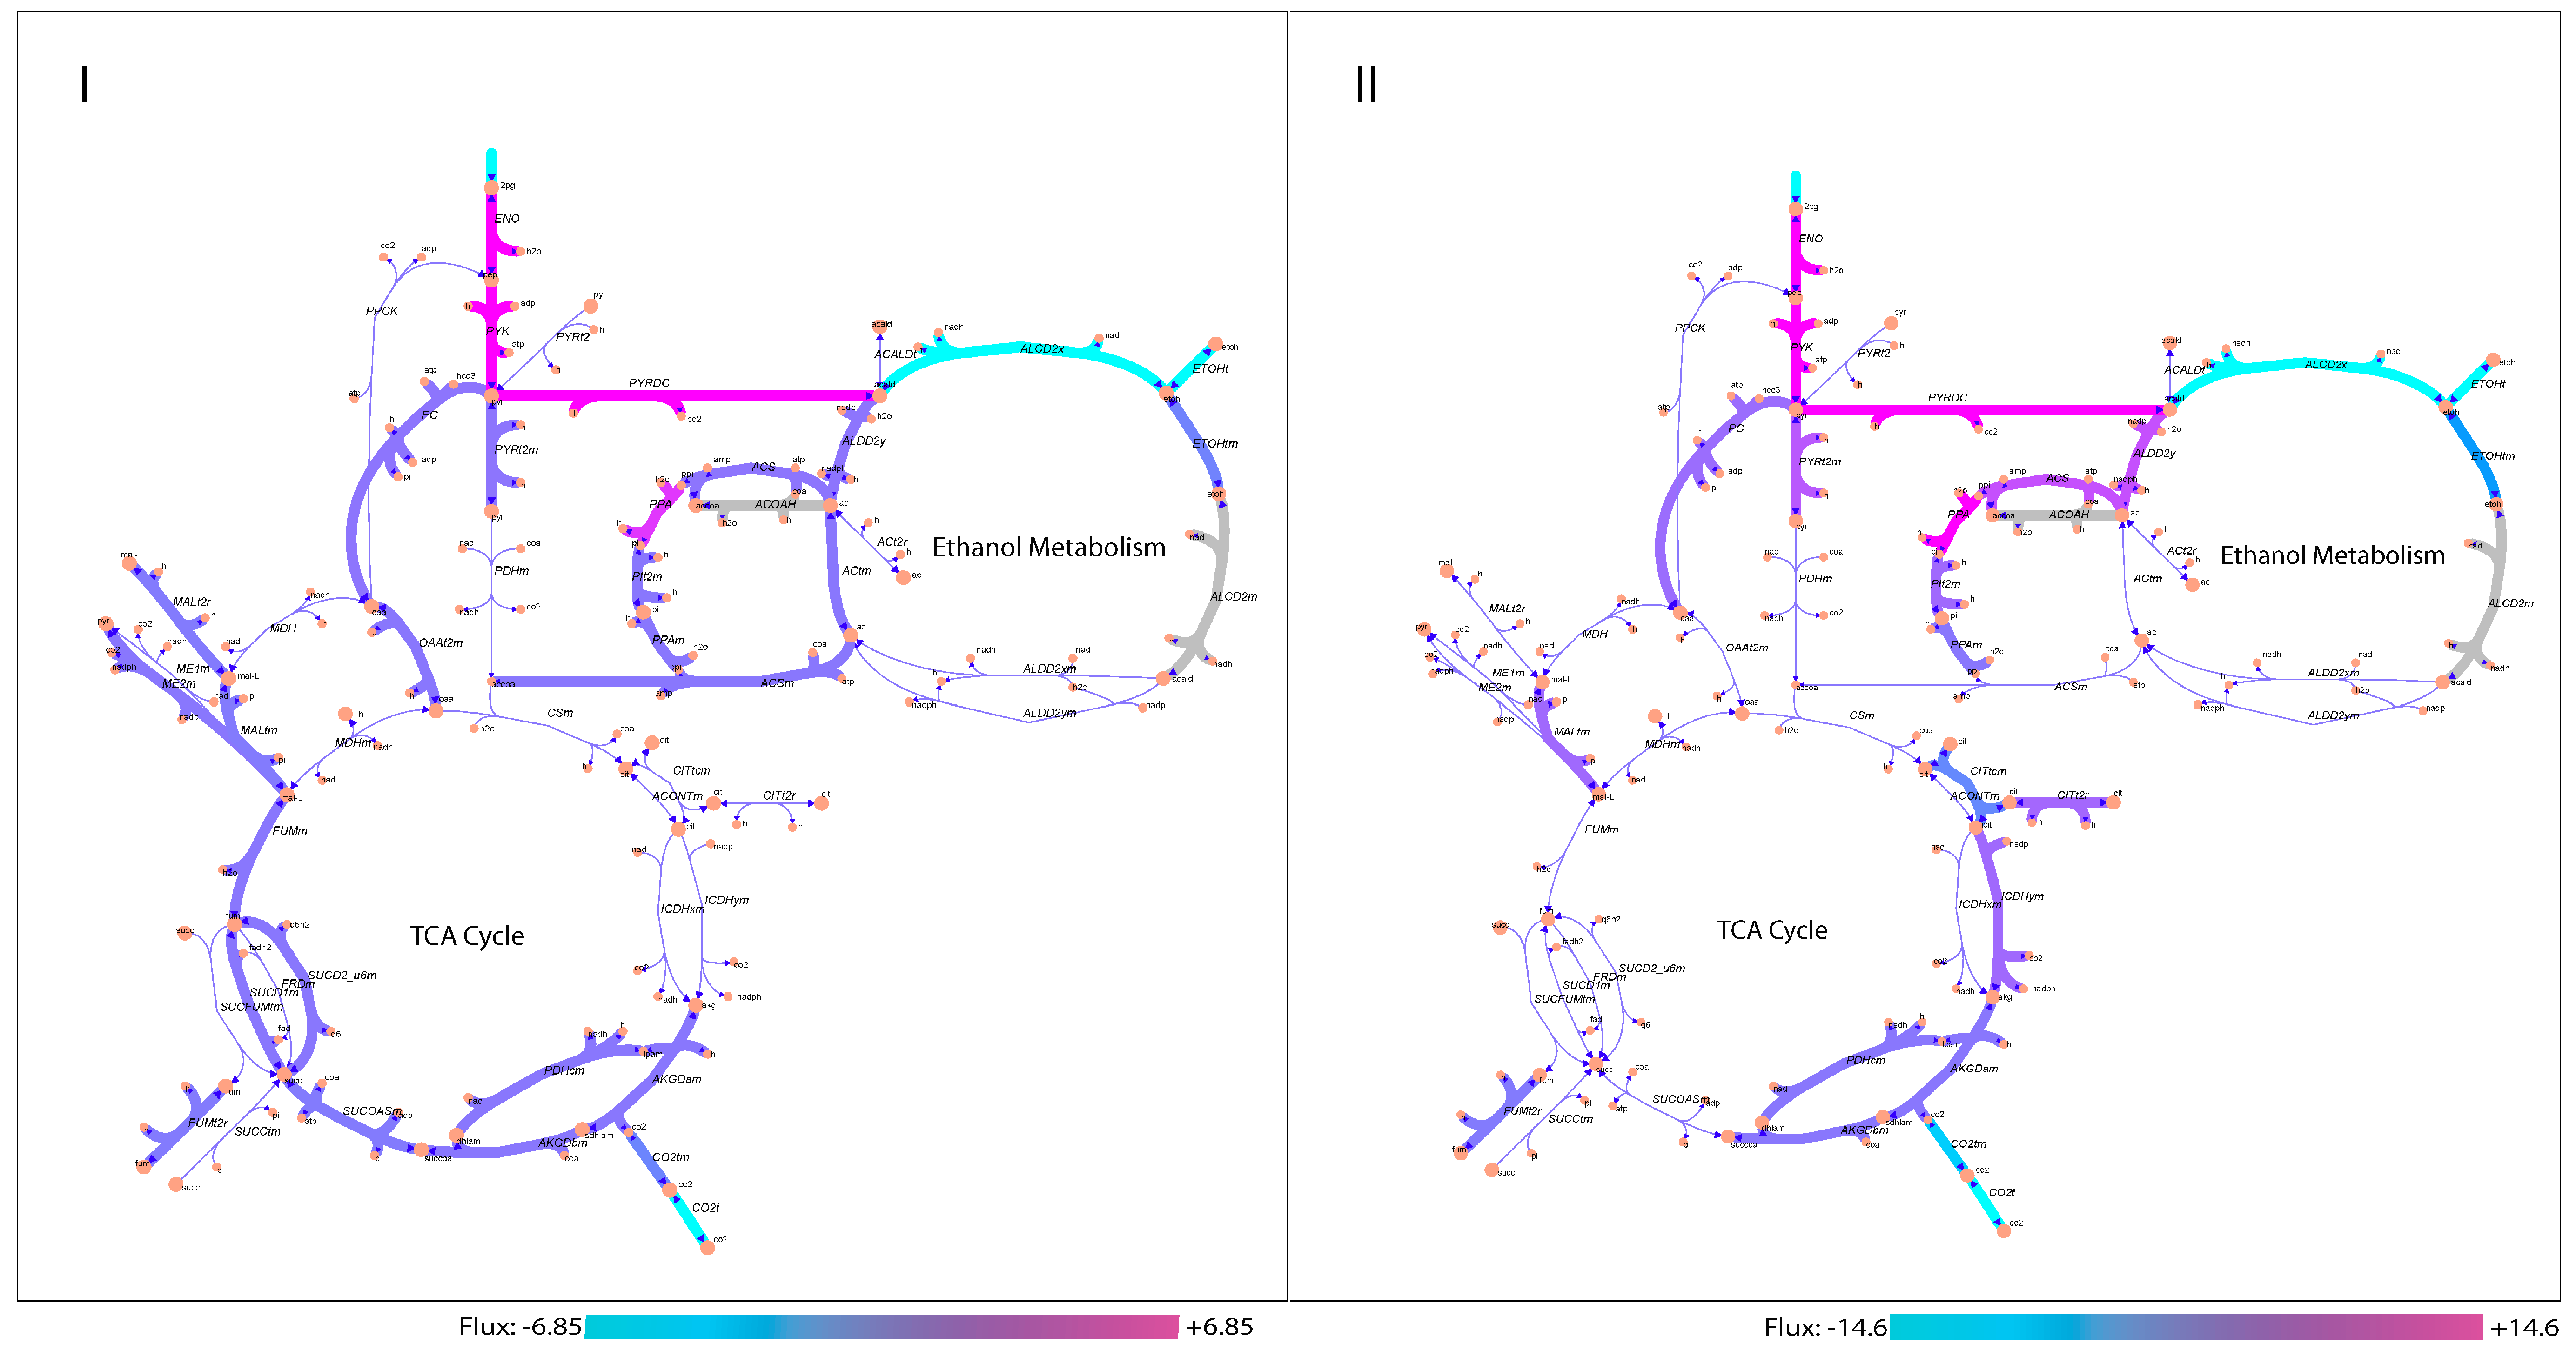
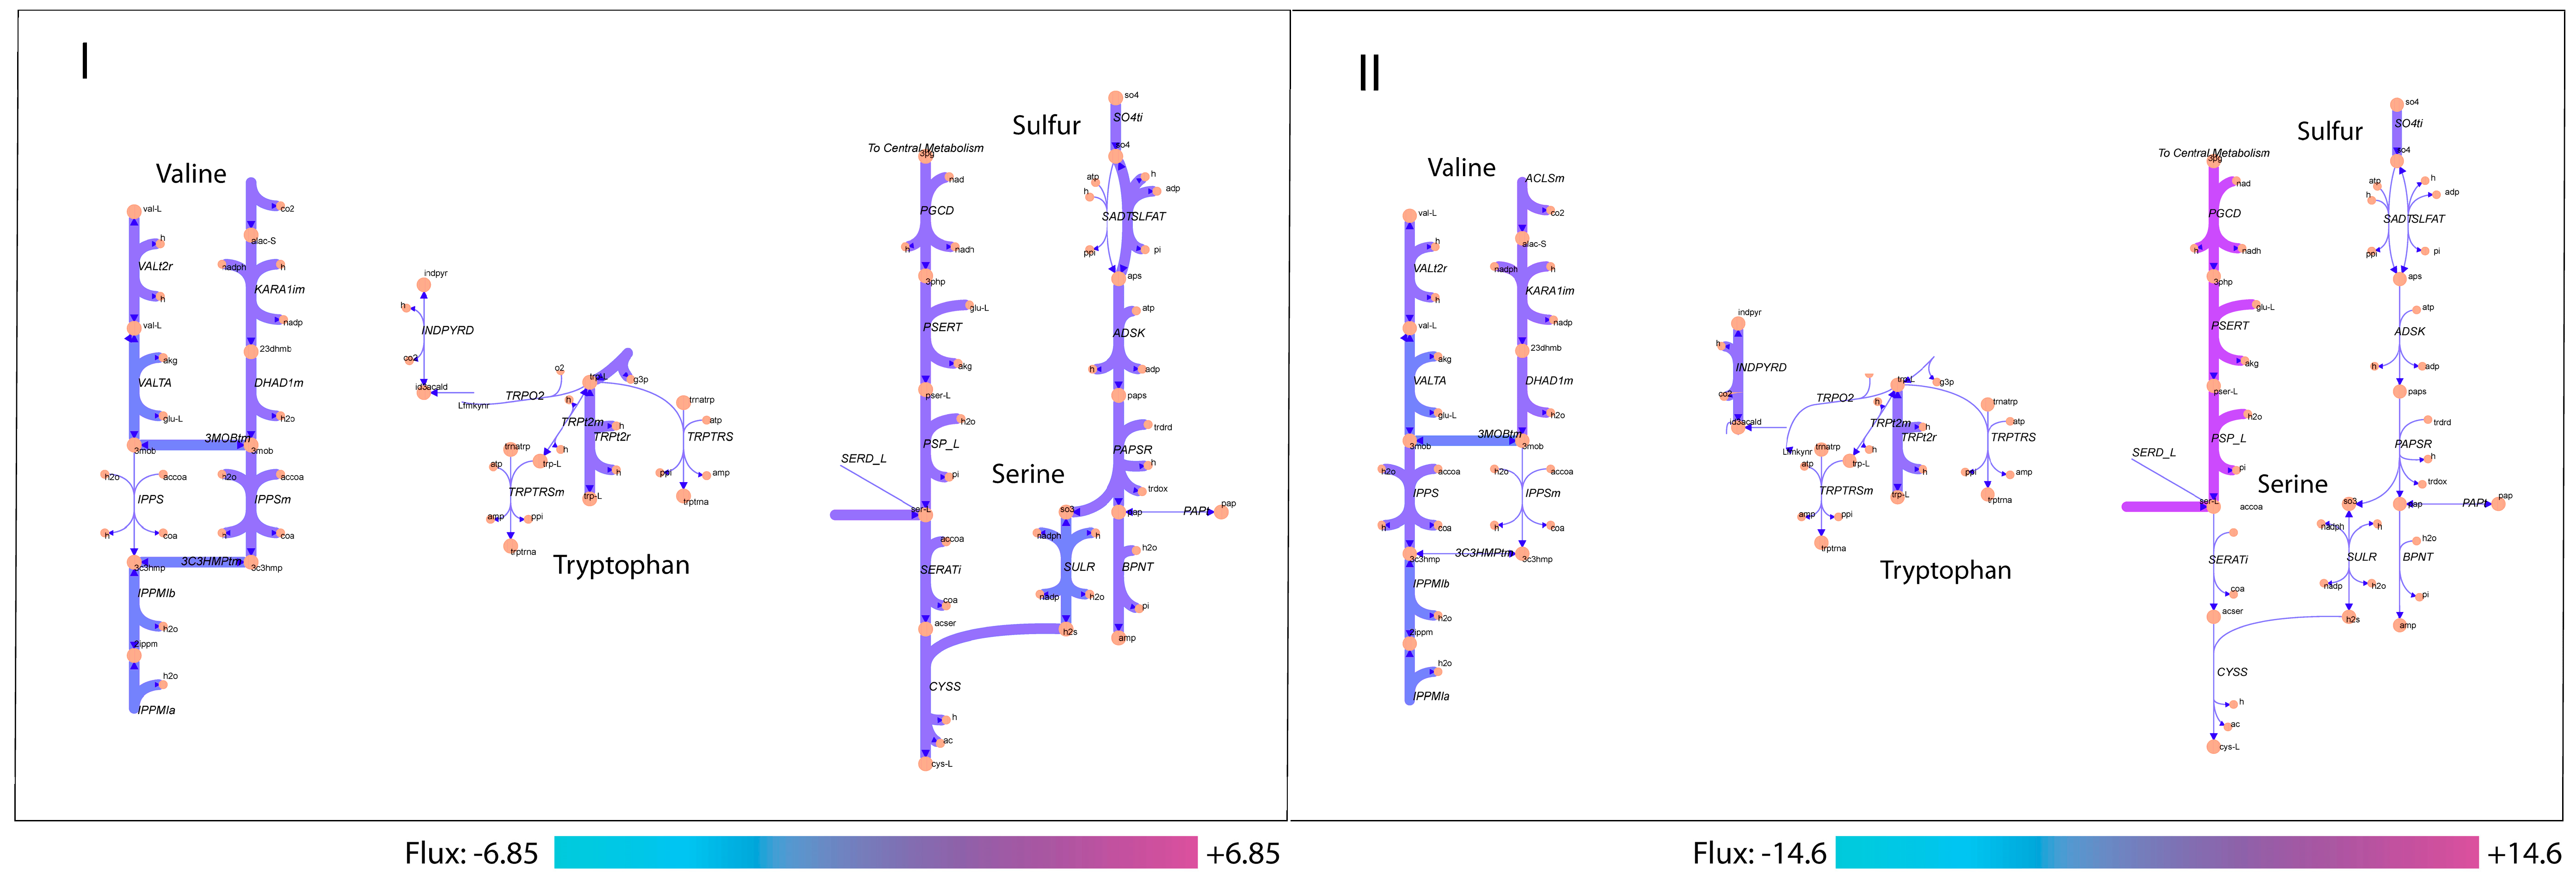
3.3. Analysis of Active Aroma Reactions in Metabolic Network

After validating the model with existing data, it was then possible to use the model to understand the differences in metabolic states of strain EC1118 between Cases I and II. Metabolic differences are visually depicted in network maps of our two phenotypes from FBA simulations for core carbon metabolism (Figure 3), as well as sulfur and amino acid degradation metabolism (Figure 4). Additionally, more complete and integrated networks featuring metabolic flux distributions within central carbon metabolism and amino acid metabolism are shown in the Supplementary Material (see Figures S3 and S4). For central carbon metabolism the most apparent differences are concerning the pyruvate-oxaloacetate node which is a major branch that functions as a linking point between glycolysis, gluconeogenesis, and the TCA cycle. Our model predicted that there is a difference in the distribution of fluxes regarding the oxaloacetate shuttle where, for Case I, there is a preference for α- ketoglutaric acid formation, whereas for Case II, there is a preference for the formation of citric acid. The model also predicts differences in the manner in which acetic acid forms (Figure 3). For Case I, the simulated metabolism favors using both aldehyde dehydrogenase and acetyl CoA synthase to produce acetate. However, for Case II, the simulated metabolic flux distribution prefers solely the aldehyde dehydrogenase route.
For amino acid metabolism, there are apparent differences in simulated flux distributions when observing utilization pathways of leucine, valine, and tryptophan (Figure 4). There is a slight difference in flux distribution between our two cases where simulated routes of leucine and valine in Case I chose a different path using IPPSm (mitochondrial isopropylmalate synthase) instead of using IPPS (cytosolic 2 isopropylmalate synthase) to form α-ketoisovaleric acid. This, in turn, impacts the predicted formation of fusel alcohols such as isobutanol. For tryptophan metabolism in Case II, the model predicts that there is flux to the production of indole-3-aldehyde, which is a precursor to tryptophol, in addition to the flux to tryptophan. The model predicts no flux being diverted to tryptophol for Case I. However, overall, there was not much difference in flux distribution of many of amino acid pathways responsible the fusel alcohols alcohol between the two cases, although the fluxes are generally higher in Case II by a factor of two.
When examining sulfur metabolism, there is a stark contrast in predicted flux distribution between the two cases, especially when examining the flow and utilization of sulfate and the sulfur-containing amino acids cysteine and methionine, which are highly involved in sulfur metabolism. In Case I, it was predicted that sulfate is further metabolized and then coupled with serine metabolism to form cysteine, whereas in Case II, flux to serine is higher and sulfate is not utilized. In addition, the model predicts fluxes directed toward formation of undesirable sulfur compounds such as hydrogen sulfide and methanethiol for Case I. However, the model predicts formation of methanethiol only for Case II.

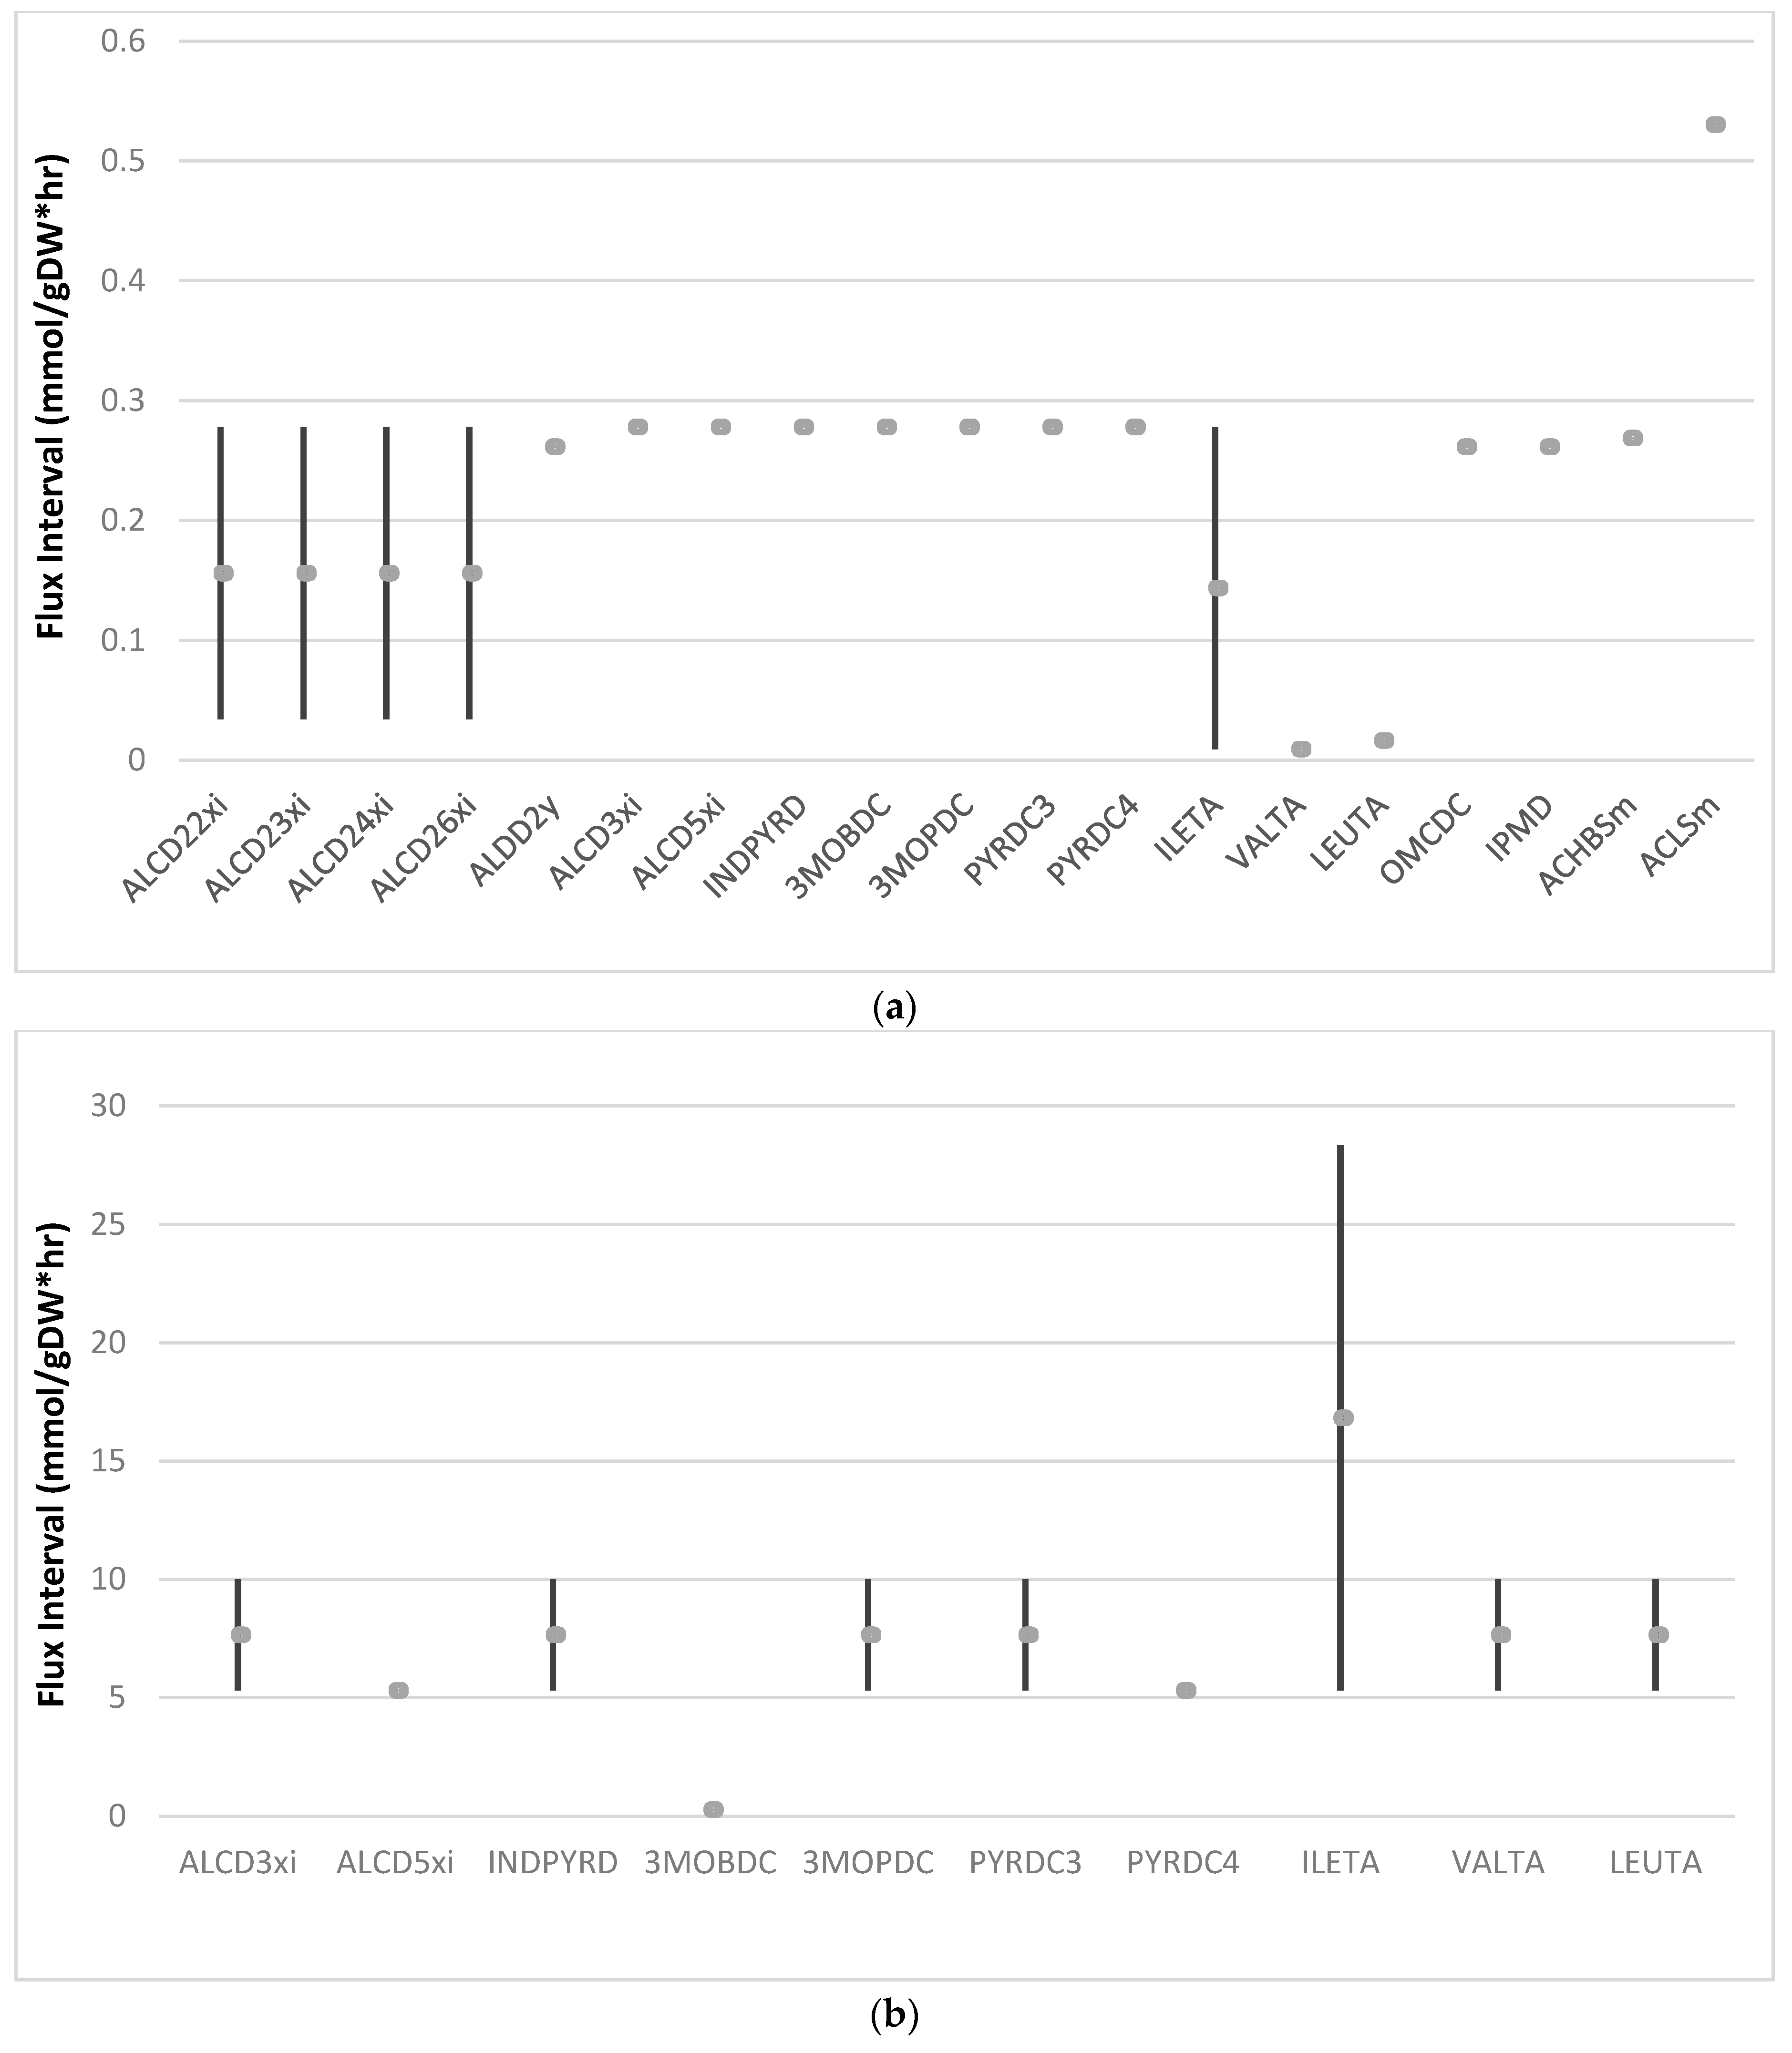
3.4. Exploring Network Flexibility via FVA

In order to be able to modulate aroma production in yeast fermentations, it is important to know which enzymes and reactions are essential and contribute most to their production. Therefore, we applied flux variability analysis (FVA) to identify these enzymes and reactions. In brief, the method computes the minimal and maximal flux values that a metabolic reaction can take without affecting the cellular objective(s). Total fusel alcohol production was chosen to be maximized here, as an example, since these aroma molecules are formed in the highest quantity (excluding ethanol) during yeast fermentation and serve as precursors to other aroma molecules such as acetate esters. To determine the flux range, we first computed the production of the maximal total fusel alcohol production using FBA. Next, the total fusel alcohol production was fixed at the value obtained from FBA and used to run FVA. FVA was performed for two scenarios: (1) the model was constrained based on experimental data on uptake and secretion rates under Case I conditions from literature [30] and (2) the model was unconstrained mimicking a “super-rich” medium (see Section 2.3). The resulting flux ranges from FVA for every reaction can be divided into three groups: (I) essential reactions, where the minimal and maximal flux is non-zero; (II) non-essential reactions, where the minimal flux is zero and maximum value is non-zero; and (III) inactive reactions, where both minimum and maximum fluxes are zero.
There are some discernible contrasts in flux variability illustrated between the two scenarios regarding Group I aroma-associated reactions (Figure 5). The total amount of Group I aroma-associated variable fluxes is different where there are 19 of these type of reactions in the Constrained Case (Figure 5a) and 10 reactions in the Unconstrained Case (Figure 5b). Since the Unconstrained Case represents an extreme rich medium it is expected that in this case the number of essential reactions is lower. However, 10 of the essential reactions overlap for the two cases. For the Constrained Case, all of these Group I essential aroma reactions contained a zero to small flux range (<0.2687 mmol gDW−1 h−1) (Figure 5). In fact, 14 out of 19 reactions have a zero-flux range representing essential reactions that when slightly changed, the objective, i.e., aroma production, will immediately change as well.

4. Discussion

Studies have pressed the need for understanding how altering the fermentation environment induces changes in secondary metabolism, especially when impacting organoleptic properties of products [10]. This illustrates the demand for suitable tools to aid in understanding the role of yeast metabolism in aroma formation especially with regard to higher alcohol and ester synthesis. We improved the GSMM for S. cerevisiae for studying wine fermentation by including aroma forming pathways previously not contained in existing S. cerevisiae GSMMs. This expanded GSMM permitted the comparison of yeast metabolism, specifically aroma formation under varying fermentation conditions. While this is an important advance over previous models, further curation and adaptation may be necessary to exhaustively predict yeast-derived aroma compounds, such as those derived from phenolics, which can sometimes be important to flavor. Despite this, one can apply approaches found in this study to expand GSMMs in order to investigate aroma in wine or other alcoholic fermentations. It was also noted here that this model still requires small fluxes of oxygen into the cells in order to predict cell growth and fermentation. Since other GSMMs [42,44,60] have been developed where this is not necessary, it would be useful to continue development on this model to incorporate this behavior, along with the ability to accurately predict yeast-derived aroma production.
Using FBA, our expanded GSMM generated relatively accurate predictions for the secondary metabolite formation including the production of volatile aroma metabolites. The model did, however, underestimate the growth rate in both Case I and II (10% in Case I and 24% in Case II). This could be due to several factors. First of all, the model biomass equation may not reflect the most precise medium conditions used in the experiment [61]. Second, there is genetic variation between wine yeast strains that affect the utilization of nitrogen which is needed for biomass growth [62]. This highlights the need for more environmental, as well as genetically specific biomass equations, including one for wine applications. Co-factor balance is confirmed based on our observation that the model with the given constraints predicts growth of biomass. Without co-factor balance, growth cannot be predicted. While the model predicted production of organic acids (succinate and lactate) close to experimental production rates for both simulated cases, acetate production in both cases was under-predicted. Acetate production is known to be coupled to additional ATP generation within yeast cells. This only happens if the redox balance is restored somewhere else in the metabolic network. In addition, the under-prediction of the acetate flux could be related to an under estimation of the maintenance coefficient, reaction—ATPM (see GSMM). This could point to competition with pyruvate dehydrogenase linked reactions within the network and respiratory pyruvate dehydrogenase (PDC5) linked reactions where PDCs facilitate more pyruvate from the pathway than necessary diverting it toward ethanol [63]. In the study by Quiros et al., the flux toward oxaloacetic acid production (OAA) was not significantly impacted by the variables investigated in the study. However, our results indicate the routes of OAA production shifted from mitochondrial production to cytosolic when going from Case I to Case II. This is interesting as it points to environmental effects (e.g., temperature) influencing the mechanism of acetate production as has been suggested in other studies [64]. High osmolarity resulting from high sugar concentrations in the feed induce glycerol production [65,66]. In addition, it is clear from these results that the model is predicting more carbon flux directed towards ethanol and glycerol production than to cell growth compared to experimental observations, which may indicate a need for further model curation.
Our GSMM describes production of volatile aroma compounds by linking aroma formation pathways to central carbon metabolism where precursors are synthesized. The production of fusel alcohols (under anaerobic conditions) can and will be used as extra capacity to regenerate NAD+. This results in adding more flexibility in the network in terms of redox co-factor regeneration. Moreover, it has been proposed that ester production enables control of intracellular redox balance and some esters are involved in the preservation of plasma membrane fluidity [67,68]. Intracellular esterification of MCFAs could also help yeast cells to get rid of toxic MCFAs through diffusion out of the plasma membrane [69]. In any case, extracellular ester production is believed to play a significant evolutionary role in leading to spread of yeast throughout the environment as esters attract insects by indicating the presence of rotting fruits [70]. Our expanded GSMM was able to predict the formation of some these desirable esters (isoamyl acetate, isobutyl acetate, and 2-methylbutyl acetate) (data not shown), where, under the Case I, there was more predicted ester production than Case II. This result is supported by studies that have indicated higher alcohol and consequently higher acetate production under higher temperature conditions [71,72]. Moreover, Saerens et al. [22] showed that alcohol O-acetyltransferase 1 (ATF1) and alcohol O-acetyltransferase 1 (ATF2) expression is positively correlated with temperature and thus would boost acetate ester production under certain temperature conditions. Production of sulfur compounds from sulfur reduction pathways is also represented in our model simulations (Supplementary Figures S1 and S2). There are some contrasts in flux distribution throughout sulfur metabolism when comparing the flux distributions found for our two cases. This can be due to the Case I having methionine or cysteine-limited conditions, thus leading to O-acetylserine and O-acetylhomoserine limitations, which results in excess sulfide that is diverted to hydrogen sulfide [73]. On the other hand, Case II could contain non-limiting cysteine or methionine concentrations which would lead to sulfide reacting with O-acetylserine or O-acetylhomoserine to form homocysteine [5].
In order to investigate the metabolic capability and the potential for suggesting metabolic modification, the solution space of our expanded GSMM was evaluated using FVA. The flexibility of the GSMM network was explored for a constrained case and an unconstrained case. When examining the unconstrained case, it is observed that there are three Group I essential aroma reactions; ALCD5xi, 3MOBDC, and PYRDC4 which have zero flux difference. These reactions are also essential with zero flux range in the constrained case, suggesting unconditional essentiality with zero flux spans. Moreover, in the genes associated with the three most essential reactions are PDC1, PDC5, PDC6, ADH1, ADH2, ADH4, ADH5, and SFA1. Many of the Group I aroma-associated reactions are closely connected to the Ehrlich pathway and several are reactions we added to the GSMM e.g., aldehyde dehydrogenases (via propanol and tyrosol). Based on these results, we propose that Group I reactions with zero flux span are of particular interest for metabolic engineering of aroma production, since these reactions will change aroma production once their fluxes are perturbed even slightly. This applies especially to the unconditionally essential ones with zero flux spans as these are environmentally independent (i.e., both present in the constrained case and the unconstrained case). In addition, our results are supported by studies that have increased higher alcohol production by modulating alcohol dehydrogenases (ADH1, ADH2) to increase higher alcohol production [74,75]. Taken together, we can conclude that, under the given experimental conditions, Group I aroma-associated reactions can serve as potential candidates for steering aroma profiles.
Even with some of these limitations, we have shown that this GSMM incorporating aroma production pathways is able to predict aroma compound production under different growth conditions and helps to explain the metabolic fluxes underlying these differences. These predictions were made using constraints relevant to winemaking or enological conditions, including mostly anaerobic and nitrogen-limited conditions. With this model, it should be possible now to predict and understand aroma metabolism in yeast over the course of an entire wine fermentation and as a function of different commercial yeast strains, thus creating a tool to modify fermentation behavior through culture conditions and strain selection or development. Although this study was specific to wine aroma formation, it is expected that the work presented here can be applied to understand and study aroma formation in other types of alcoholic fermentations as well.

5. Conclusions

In this study, a GSMM for S. cerevisiae was expanded by adding metabolic pathways that lead to the formation of various aroma compounds. Many aroma compounds producing pathways particularly related to ester and sulfur formation were incorporated into a widely used GSMM for S. cerevisiae. This study is distinctive from previous aforementioned studies in that it applies a GSMM to comprehensively study yeast metabolic impacts on aroma formation under enological conditions. This expanded model was used for examining aroma formation under enological conditions with input of published experimental data for two growth conditions. By applying FBA, fermentation performance such as biomass growth rates and product secretion rates were predicted and compared favorably to experimental values for a commercial yeast strain. Furthermore, we applied the extended model to compare key differences in metabolic flux distributions between the two growth condition cases. Finally, we predicted key essential reactions that are of particular interest for metabolic engineering purposes aiming to modulate aroma production. Therefore, we have illustrated how this newly expanded GSMM can be a helpful tool for winemakers and researchers alike that are interested in understanding aroma formation during wine formation.

Supplementary Materials

The following are available online at https://www.mdpi.com/2227-9717/8/9/1195/s1, Figure S1. Comparison of GSMM simulations (Red bars) with experimental data [30] (Blue bars). Model predicted and experimental values for biomass growth rates, primary metabolite production fluxes, and secondary metabolite production fluxes represent conditions for Case III and Case IV. Experimental data are shown with standard deviation error bars; Figure S2. Comprehensive metabolic network map of yeast (S. cerevisiae); Figure S3. Network map of central carbon metabolism (left) and amino acid metabolism (right). Network fluxes were determined using data from Case I where the network illustrates the optimal solution from FBA. The fluxes were scaled between −1 and +1 for ease of visualization; Figure S4. Network map of central carbon metabolism (left) and amino acid metabolism (right). Network fluxes were determined using data from Case II where the network illustrates the optimal solution from FBA. The fluxes were scaled between −1 and +1 for ease of visualization; Table S1. Genes added to current GSMM; Table S2. Metabolites added to current GSMM; Table S3. Reactions added to current GSMM; Table S4. Experimentally measured consumption/production rates of the different metabolites analyzed from Quiros et al. 2013 and constraints used in the study.

Author Contributions

Conceptualization, W.T.S.J., E.J.S., R.A.N., and D.E.B.; Formal analysis, W.T.S.J.; Funding acquisition, D.E.B.; Investigation, W.T.S.J. and D.E.B.; Methodology, W.T.S.J., E.J.S., and R.A.N.; Project administration, E.J.S., R.A.N., and D.E.B.; Supervision, E.J.S., R.A.N. and D.E.B.; Visualization, W.T.S.J.; Writing—original draft, W.T.S.J.; Writing—review and editing, W.T.S.J., E.J.S., R.A.N., and D.E.B. All authors have read and agreed to the published version of the manuscript.

Funding

This research was funded by the American Vineyard Foundation, grant number 2252, as well as the Ernest Gallo Endowed Chair in Viticulture and Enology.

Conflicts of Interest

The authors declare no conflict of interest. The funders had no role in the design of the study; in the collection, analyses, or interpretation of data; in the writing of the manuscript, or in the decision to publish the results.

Abbreviations

FBAFlux Balance Analysis
FVAFlux Variability Analysis
GSMMGenome-scale metabolic model
MCFAmedium-chain fatty acid
ALCD22xialdehyde dehydrogenase (via 2 methylbutanol NAD)
ALCD23xialdehyde dehydrogenase (via isobutyl alcohol NAD)
ALCD24xialdehyde dehydrogenase (via isoamyl alcohol NAD)
ALCD26xialdehyde dehydrogenase (via tryptophol NAD)
ALDD2yaldehyde dehydrogenase (via acetaldehyde NADP)
ALCD3xialdehyde dehydrogenase (via propanol NAD)
ALCD5xialdehyde dehydrogenase (via tyrosol NAD)
INDPYRDindole-3 pyruvate decarboxylase
3MOBDC3 methyl 2 oxobutanoate decarboxylase
3MOPDC3 methyl 2 oxopentanoate decarboxylase
PYRDC3pyruvate decarboxylase (aldehyde forming)
PYRDC4pyruvate decarboxylase (hydroxyl phenyl)
ILETAisoleucine transaminase
VALTAvaline transaminase
LEUTAleucine transaminase
OMCDC2 oxo 4 methyl 3 carboxypentanoate decarboxylation
IPMD3 isopropylmalate dehydrogenase
ACHBSm2 aceto 2 hydroxybutanoate synthase (mitochondrial)
ACLSmacetolactate synthase (mitochondrial)

References

  1. Vandamme, E.J.; Soetaert, W. Bioflavours and fragrances via fermentation and biocatalysis. J. Chem. Technol. Biotechnol. 2002, 77, 1323–1332. [Google Scholar] [CrossRef]
  2. Rossouw, D.; Bauer, F.F. Comparing the transcriptomes of wine yeast strains: Toward understanding the interaction between environment and transcriptome during fermentation. Appl. Microbiol. Biotechnol. 2009, 84, 937–954. [Google Scholar] [CrossRef]
  3. Rossouw, D.; van den Dool, A.H.; Jacobson, D.; Bauer, F.F. Comparative transcriptomic and proteomic profiling of industrial wine yeast strains. Appl. Environ. Microbiol. 2010, 76, 3911–3923. [Google Scholar] [CrossRef] [Green Version]
  4. Hazelwood, L.A.; Daran, J.M.; van Maris, A.J.A.; Pronk, J.T.; Dickinson, J.R. The Ehrlich pathway for fusel alcohol production: A century of research on Saccharomyces cerevisiae metabolism. Appl. Environ. Microbiol. 2008, 74, 2259–2266. [Google Scholar] [CrossRef] [PubMed] [Green Version]
  5. Swiegers, J.H.; Pretorius, I.S. Yeast modulation of wine flavor. In Advances in Applied Microbiology; Laskin, A.I., Bennett, J.W., Gadd, G.M., Eds.; Elsevier: Amsterdam, The Netherlands, 2005; Volume 57, pp. 131–175. [Google Scholar]
  6. Verstrepen, K.J.; Van Laere, S.D.M.; Vanderhaegen, B.M.P.; Derdelinckx, G.; Dufour, J.P.; Pretorius, I.S.; Winderickx, J.; Thevelein, J.M.; Delvaux, F.R. Expression levels of the yeast alcohol acetyltransferase genes atf1, lg-atf1, and atf2 control the formation of a broad range of volatile esters. Appl. Environ. Microbiol. 2003, 69, 5228–5237. [Google Scholar] [CrossRef] [PubMed] [Green Version]
  7. Knight, M.J.; Bull, I.D.; Curnow, P. The yeast enzyme Eht1 is an octanoyl-CoA: Ethanol acyltransferase that also functions as a thioesterase. Yeast 2014, 31, 463–474. [Google Scholar] [PubMed] [Green Version]
  8. Dzialo, M.C.; Park, R.; Steensels, J.; Lievens, B.; Verstrepen, K.J. Physiology, ecology and industrial applications of aroma formation in yeast. FEMS Microbiol. Rev. 2017, 41, S95–S128. [Google Scholar] [CrossRef] [Green Version]
  9. Rauhut, D. Yeasts-production of sulfur compounds. Wine Microbiol. Biotechnol. 1993, 6, 183–223. [Google Scholar]
  10. Hirst, M.B.; Richter, C.L. Review of aroma formation through metabolic pathways of Saccharomyces cerevisiae in beverage fermentations. Am. J. Enol. Vitic. 2016, 67, 361–370. [Google Scholar] [CrossRef] [Green Version]
  11. Dunn, B.; Levine, R.P.; Sherlock, G. Microarray karyotyping of commercial wine yeast strains reveals shared, as well as unique, genomic signatures. BMC Genom. 2005, 6, 53. [Google Scholar] [CrossRef] [Green Version]
  12. Henschke, P.; Jiranek, V. Yeasts-metabolism of nitrogen compounds. In Wine Microbiology and Biotechnology; Fleet, G., Ed.; Harwood Academic Publishers: Chur, Switzerland, 1993; pp. 77–164. [Google Scholar]
  13. Verstrepen, K.J.; Iserentant, D.; Malcorps, P.; Derdelinckx, G.; Van Dijck, P.; Winderickx, J.; Pretorius, I.S.; Thevelein, J.M.; Delvaux, F.R. Glucose and sucrose: Hazardous fast-food for industrial yeast? Trends Biotechnol. 2004, 22, 531–537. [Google Scholar] [CrossRef] [PubMed]
  14. Gallone, B.; Steensels, J.; Prahl, T.; Soriaga, L.; Saels, V.; Herrera-Malaver, B.; Merlevede, A.; Roncoroni, M.; Voordeckers, K.; Miraglia, L.; et al. Domestication and divergence of Saccharomyces cerevisiae beer yeasts. Cell 2016, 166, 1397–1410. [Google Scholar] [CrossRef] [PubMed] [Green Version]
  15. Howell, K.S.; Klein, M.; Swiegers, J.H.; Hayasaka, Y.; Elsey, G.M.; Fleet, G.H.; Hoj, P.B.; Pretorius, I.S.; Lopes, M.A.D. Genetic determinants of volatile-thiol release by Saccharomyces cerevisiae during wine fermentation. Appl. Environ. Microbiol. 2005, 71, 5420–5426. [Google Scholar] [CrossRef] [PubMed] [Green Version]
  16. Rossouw, D.; Naes, T.; Bauer, F.F. Linking gene regulation and the exo-metabolome: A comparative transcriptomics approach to identify genes that impact on the production of volatile aroma compounds in yeast. BMC Genom. 2008, 9, 530. [Google Scholar] [CrossRef] [Green Version]
  17. Richter, C.L.; Dunn, B.; Sherlock, G.; Pugh, T. Comparative metabolic footprinting of a large number of commercial wine yeast strains in chardonnay fermentations. FEMS Yeast Res. 2013, 13, 394–410. [Google Scholar] [CrossRef] [Green Version]
  18. Lee, S.-J.; Rathbone, D.; Asimont, S.; Adden, R.; Ebeler, S.E. Dynamic changes in ester formation during chardonnay juice fermentations with different yeast inoculation and initial brix conditions. Am. J. Enol. Vitic. 2004, 55, 346–354. [Google Scholar]
  19. Miller, A.C.; Wolff, S.R.; Bisson, L.F.; Ebeler, S.E. Yeast strain and nitrogen supplementation: Dynamics of volatile ester production in chardonnay juice fermentations. Am. J. Enol. Vitic. 2007, 58, 470–483. [Google Scholar]
  20. Steyer, D.; Ambroset, C.; Brion, C.; Claudel, P.; Delobel, P.; Sanchez, I.; Erny, C.; Blondin, B.; Karst, F.; Legras, J.L. QTL mapping of the production of wine aroma compounds by yeast. BMC Genom. 2012, 13, 573. [Google Scholar] [CrossRef] [Green Version]
  21. Garcia-Rios, E.; Lopez-Malo, M.; Guillamon, J.M. Global phenotypic and genomic comparison of two Saccharomyces cerevisiae wine strains reveals a novel role of the sulfur assimilation pathway in adaptation at low temperature fermentations. BMC Genom. 2014, 15, 1059. [Google Scholar] [CrossRef] [Green Version]
  22. Saerens, S.M.G.; Delvaux, F.; Verstrepen, K.J.; Van Dijck, P.; Thevelein, J.M.; Delvaux, F.R. Parameters affecting ethyl ester production by Saccharomyces cerevisiae during fermentation. Appl. Environ. Microbiol. 2008, 74, 454–461. [Google Scholar] [CrossRef] [Green Version]
  23. Kruis, A.J.; Levisson, M.; Mars, A.E.; van der Ploeg, M.; Daza, F.G.; Ellena, V.; Kengen, S.W.M.; van der Oost, J.; Weusthuis, R.A. Ethyl acetate production by the elusive alcohol acetyltransferase from yeast. Metab. Eng. 2017, 41, 92–101. [Google Scholar] [CrossRef] [PubMed]
  24. Kruis, A.J.; Gallone, B.; Jonker, T.; Mars, A.E.; van Rijswijck, I.M.H.; Wolkers-Rooijackers, J.C.M.; Smid, E.J.; Steensels, J.; Verstrepen, K.J.; Kengen, S.W.M.; et al. Contribution of eat1 and other alcohol acyltransferases to ester production in Saccharomyces cerevisiae. Front. Microbiol. 2018, 9, 3202. [Google Scholar] [CrossRef] [PubMed]
  25. Cherry, J.M.; Hong, E.L.; Amundsen, C.; Balakrishnan, R.; Binkley, G.; Chan, E.T.; Christie, K.R.; Costanzo, M.C.; Dwight, S.S.; Engel, S.R.; et al. Saccharomyces genome database: The genomics resource of budding yeast. Nucleic Acids Res. 2012, 40, D700–D705. [Google Scholar] [CrossRef] [PubMed] [Green Version]
  26. Vallino, J.J.; Stephanopoulos, G. Metabolic flux distributions in Corynebacterium glutamicum during growth and lysine overproduction. Biotechnol. Bioeng. 1993, 41, 633–646. [Google Scholar] [CrossRef] [PubMed]
  27. Varma, A.; Palsson, B.O. Metabolic capabilities of Escherichia coli: I. Synthesis of biosynthetic precursors and cofactors. J. Theor. Biol. 1993, 165, 477–502. [Google Scholar] [CrossRef]
  28. Pramanik, J.; Keasling, J.D. Stoichiometric model of Escherichia coli metabolism: Incorporation of growth-rate dependent biomass composition and mechanistic energy requirements. Biotechnol. Bioeng. 1997, 56, 398–421. [Google Scholar] [CrossRef]
  29. Pizarro, F.; Varela, C.; Martabit, C.; Bruno, C.; Prez-Correa, J.R.; Agosin, E. Coupling kinetic expressions and metabolic networks for predicting wine fermentations. Biotechnol. Bioeng. 2007, 98, 986–998. [Google Scholar] [CrossRef]
  30. Quiros, M.; Martinez-Moreno, R.; Albiol, J.; Morales, P.; Vazquez-Lima, F.; Barreiro-Vazquez, A.; Ferrer, P.; Gonzalez, R. Metabolic flux analysis during the exponential growth phase of Saccharomyces cerevisiae in wine fermentations. PLoS ONE 2013, 8, e71909. [Google Scholar] [CrossRef] [Green Version]
  31. Aceituno, F.F.; Orellana, M.; Torres, J.; Mendoza, S.; Slater, A.W.; Melo, F.; Agosin, E. Oxygen response of the wine yeast Saccharomyces cerevisiae EC1118 grown under carbon-sufficient, nitrogen-limited enological conditions. Appl. Environ. Microbiol. 2012, 78, 8340–8352. [Google Scholar] [CrossRef] [Green Version]
  32. Li, H.; Su, J.; Ma, W.; Guo, A.; Shan, Z.; Wang, H. Metabolic flux analysis of Saccharomyces cerevisiae in a sealed winemaking fermentation system. FEMS Yeast Res. 2015, 15. [Google Scholar] [CrossRef]
  33. Forster, J.; Famili, I.; Fu, P.; Palsson, B.O.; Nielsen, J. Genome-scale reconstruction of the Saccharomyces cerevisiae metabolic network. Genome Res. 2003, 13, 244–253. [Google Scholar] [CrossRef] [PubMed] [Green Version]
  34. Duarte, N.C.; Herrgard, M.J.; Palsson, B.O. Reconstruction and validation of Saccharomyces cerevisiae iND750, a fully compartmentalized genome-scale metabolic model. Genome Res. 2004, 14, 1298–1309. [Google Scholar] [CrossRef] [PubMed] [Green Version]
  35. Nookaew, I.; Jewett, M.C.; Meechai, A.; Thammarongtham, C.; Laoteng, K.; Cheevadhanarak, S.; Nielsen, J.; Bhumiratana, S. The genome-scale metabolic model iIN800 of Saccharomyces cerevisiae and its validation: A scaffold to query lipid metabolism. BMC Syst. Biol. 2008, 2, 71. [Google Scholar] [CrossRef] [PubMed] [Green Version]
  36. Mo, M.L.; Palsson, B.Ø.; Herrgård, M.J. Connecting extracellular metabolomic measurements to intracellular flux states in yeast. BMC Syst. Biol. 2009, 3, 37. [Google Scholar] [CrossRef] [Green Version]
  37. Dobson, P.D.; Smallbone, K.; Jameson, D.; Simeonidis, E.; Lanthaler, K.; Pir, P.; Lu, C.; Swainston, N.; Dunn, W.B.; Fisher, P.; et al. Further developments towards a genome-scale metabolic model of yeast. BMC Syst. Biol. 2010, 4, 145. [Google Scholar] [CrossRef] [Green Version]
  38. Vargas, F.A.; Pizarro, F.; Pérez-Correa, J.R.; Agosin, E. Expanding a dynamic flux balance model of yeast fermentation to genome-scale. BMC Syst. Biol. 2011, 5, 75. [Google Scholar] [CrossRef] [Green Version]
  39. Nissen, T.L.; Schulze, U.; Nielsen, J.; Villadsen, J. Flux distributions in anaerobic, glucose-limited continuous cultures of Saccharomyces cerevisiae. Microbiology 1997, 143, 203–218. [Google Scholar] [CrossRef] [Green Version]
  40. Zomorrodi, A.R.; Maranas, C.D. Improving the iMM904 S. cerevisiae metabolic model using essentiality and synthetic lethality data. BMC Syst. Biol. 2010, 4, 178. [Google Scholar]
  41. Papp, B.; Szappanos, B.; Notebaart, R.A. Use of genome-scale metabolic models in evolutionary systems biology. Methods Mol. Biol. 2011, 759, 483–497. [Google Scholar]
  42. Lu, H.; Li, F.; Sanchez, B.J.; Zhu, Z.; Li, G.; Domenzain, I.; Marcisauskas, S.; Anton, P.M.; Lappa, D.; Lieven, C.; et al. A consensus S. cerevisiae metabolic model Yeast 8 and its ecosystem for comprehensively probing cellular metabolism. Nat. Commun. 2019, 10, 3586. [Google Scholar] [CrossRef] [Green Version]
  43. Heavner, B.D.; Price, N.D. Comparative analysis of yeast metabolic network models highlights progress, opportunities for metabolic reconstruction. PLoS Comput. Biol. 2015, 11, e1004530. [Google Scholar] [CrossRef] [PubMed] [Green Version]
  44. Heavner, B.D.; Smallbone, K.; Barker, B.; Mendes, P.; Walker, L.P. Yeast 5—An expanded reconstruction of the Saccharomyces cerevisiae metabolic network. BMC Syst. Biol. 2012, 6, 55. [Google Scholar] [CrossRef] [Green Version]
  45. Sánchez, B.J.; Zhang, C.; Nilsson, A.; Lahtvee, P.-J.; Kerkhoven, E.J.; Nielsen, J. Improving the phenotype predictions of a yeast genome-scale metabolic model by incorporating enzymatic constraints. Mol. Syst. Biol. 2017, 13, 935. [Google Scholar] [CrossRef] [PubMed]
  46. Orth, J.D.; Thiele, I.; Palsson, B.O. What is flux balance analysis? Nat. Biotechnol. 2010, 28, 245–248. [Google Scholar] [CrossRef]
  47. Varma, A.; Palsson, B.O. Stoichiometric flux balance models quantitatively predict growth and metabolic by-product secretion in wild-type Escherichia coli w3110. Appl. Environ. Microbiol. 1994, 60, 3724–3731. [Google Scholar] [CrossRef] [PubMed] [Green Version]
  48. Palsson, B. Systems Biology; Cambridge University Press: Cambridge, UK, 2015. [Google Scholar]
  49. Mahadevan, R.; Schilling, C.H. The effects of alternate optimal solutions in constraint-based genome-scale metabolic models. Metab. Eng. 2003, 5, 264–276. [Google Scholar] [CrossRef]
  50. Becker, S.A.; Feist, A.M.; Mo, M.L.; Hannum, G.; Palsson, B.O.; Herrgard, M.J. Quantitative prediction of cellular metabolism with constraint-based models: The cobra toolbox. Nat. Protoc. 2007, 2, 727–738. [Google Scholar] [CrossRef]
  51. Schellenberger, J.; Que, R.; Fleming, R.M.T.; Thiele, I.; Orth, J.D.; Feist, A.M.; Zielinski, D.C.; Bordbar, A.; Lewis, N.E.; Rahmanian, S.; et al. Quantitative prediction of cellular metabolism with constraint-based models: The cobra toolbox v2.0. Nat. Protoc. 2011, 6, 1290–1307. [Google Scholar] [CrossRef] [PubMed] [Green Version]
  52. Heirendt, L.; Arreckx, S.; Pfau, T.; Mendoza, S.N.; Richelle, A.; Heinken, A.; Haraldsdóttir, H.S.; Wachowiak, J.; Keating, S.M.; Vlasov, V.; et al. Creation and analysis of biochemical constraint-based models using the cobra toolbox v.3.0. Nat. Protoc. 2019, 14, 639–702. [Google Scholar] [CrossRef] [Green Version]
  53. Droste, P.; Miebach, S.; Niedenführ, S.; Wiechert, W.; Nöh, K. Visualizing multi-omics data in metabolic networks with the software omix—A case study. Biosystems 2011, 105, 154–161. [Google Scholar] [CrossRef] [PubMed]
  54. King, Z.A.; Dräger, A.; Ebrahim, A.; Sonnenschein, N.; Lewis, N.E.; Palsson, B.O. Escher: A web application for building, sharing, and embedding data-rich visualizations of biological pathways. PLoS Comput. Biol. 2015, 11, e1004321. [Google Scholar] [CrossRef] [Green Version]
  55. Ehrlich, F. Über die bedingungen der fuselölbildung und über ihren zusammenhang mit dem eiweissaufbau der hefe. Ber. Dtsch. Chem. Ges. 1907, 40, 1027–1047. [Google Scholar] [CrossRef] [Green Version]
  56. Sentheshanmuganathan, S. The mechanism of the formation of higher alcohols from amino acids by Saccharomyces cerevisiae. Biochem. J. 1960, 74, 568–576. [Google Scholar] [CrossRef] [PubMed] [Green Version]
  57. Saerens, S.M.; Delvaux, F.R.; Verstrepen, K.J.; Thevelein, J.M. Production and biological function of volatile esters in Saccharomyces cerevisiae. Microb. Biotechnol. 2010, 3, 165–177. [Google Scholar] [CrossRef] [PubMed] [Green Version]
  58. Spiropoulos, A.; Bisson, L.F. MET17 and hydrogen sulfide formation in Saccharomyces cerevisiae. Appl. Environ. Microbiol. 2000, 66, 4421–4426. [Google Scholar] [CrossRef] [Green Version]
  59. Dekoninck, T. Bottle Conditioning of Beer Strategies to Improve Yeast Refermentation Performance; Katholieke Universiteit Leuven: Leuven, Belgium, 2012. [Google Scholar]
  60. Aung, H.W.; Henry, S.A.; Walker, L.P. Revising the representation of fatty acid, glycerolipid, and glycerophospholipid metabolism in the consensus model of yeast metabolism. Ind. Biotechnol. 2013, 9, 215–228. [Google Scholar] [CrossRef] [Green Version]
  61. Dikicioglu, D.; Kirdar, B.; Oliver, S.G. Biomass composition: The “elephant in the room“ of metabolic modelling. Metabolomics 2015, 11, 1690–1701. [Google Scholar] [CrossRef] [Green Version]
  62. Gutiérrez, A.; Beltran, G.; Warringer, J.; Guillamón, J.M. Genetic basis of variations in nitrogen source utilization in four wine commercial yeast strains. PLoS ONE 2013, 8, e67166. [Google Scholar] [CrossRef] [Green Version]
  63. Agarwal, P.K.; Uppada, V.; Noronha, S.B. Comparison of pyruvate decarboxylases from Saccharomyces cerevisiae and komagataella pastoris (Pichia pastoris). Appl. Microbiol. Biotechnol. 2013, 97, 9439–9449. [Google Scholar] [CrossRef]
  64. Romano, P.; Suzzi, G.; Turbanti, L.; Polsinelli, M. Acetaldehyde production in Saccharomyces cerevisiae wine yeasts. FEMS Microbiol. Lett. 1994, 118, 213–218. [Google Scholar] [CrossRef]
  65. Rankine, B.C.; Bridson, D.A. Glycerol in australian wines and factors influencing its formation. Am. J. Enol. Vitic. 1971, 22, 6–12. [Google Scholar]
  66. Pigeau, G.M.; Inglis, D.L. Upregulation of ALD3 and GPD1 in Saccharomyces cerevisiae during icewine fermentation. J. Appl. Microbiol. 2005, 99, 112–125. [Google Scholar] [CrossRef]
  67. Malcorps, P.; Dufour, J.-P. Short-chain and medium-chain aliphatic-ester synthesis in Saccharomyces cerevisiae. Eur. J. Biochem. 1992, 210, 1015–1022. [Google Scholar] [CrossRef]
  68. Mason, A.B.; Dufour, J.-P. Alcohol acetyltransferases and the significance of ester synthesis in yeast. Yeast 2000, 16, 1287–1298. [Google Scholar] [CrossRef]
  69. Nordström, K. Studies on the Formation of Volatile Esters in Fermentation with Brewer’s Yeast. Ph.D. Thesis, Kungliga Tekniska Högskolan, Stockholm, Sweden, 1964. [Google Scholar]
  70. El-Sayed, A.M.; Heppelthwaite, V.J.; Manning, L.M.; Gibb, A.R.; Suckling, D.M. Volatile constituents of fermented sugar baits and their attraction to lepidopteran species. J. Agric. Food Chem. 2005, 53, 953–958. [Google Scholar] [CrossRef]
  71. Molina, A.M.; Swiegers, J.H.; Varela, C.; Pretorius, I.S.; Agosin, E. Influence of wine fermentation temperature on the synthesis of yeast-derived volatile aroma compounds. Appl. Microbiol. Biotechnol. 2007, 77, 675–687. [Google Scholar] [CrossRef]
  72. Birch, A.N.; Petersen, M.A.; Arneborg, N.; Hansen, Å.S. Influence of commercial baker’s yeasts on bread aroma profiles. Food Res. Int. 2013, 52, 160–166. [Google Scholar] [CrossRef]
  73. Thomas, D.; Surdin-Kerjan, Y. Metabolism of sulfur amino acids in Saccharomyces cerevisiae. Microbiol. Mol. Biol. Rev. 1997, 61, 503–532. [Google Scholar] [CrossRef]
  74. Shen, L.; Nishimura, Y.; Matsuda, F.; Ishii, J.; Kondo, A. Overexpressing enzymes of the ehrlich pathway and deleting genes of the competing pathway in Saccharomyces cerevisiae for increasing 2-phenylethanol production from glucose. J. Biosci. Bioeng. 2016, 122, 34–39. [Google Scholar] [CrossRef]
  75. Park, S.-H.; Kim, S.; Hahn, J.-S. Metabolic engineering of Saccharomyces cerevisiae for the production of isobutanol and 3-methyl-1-butanol. Appl. Microbiol. Biotechnol. 2014, 98, 9139–9147. [Google Scholar] [CrossRef]
Figure 1. Representation of the the components of the yeast genome-scale metabolic model (GSMM) related to aroma formation. Each colored section shows metabolism related to a respective class of aroma compounds, including the expanded pathways related to amino acid and fatty acid degradation and sulfur reduction pathways, as well as formation of fusel alcohols, esters, and sulfur compounds in yeast model metabolism. The entire metabolic network utilized is shown in the Supplementary Material (Figure S2).
Processes 08 01195 g001
Figure 2. Comparison of GSMM simulations (red bars) with experimental data [30] (blue bars). Model predicted and experimental values for biomass growth rates, primary metabolite production fluxes, and secondary metabolite production fluxes represent conditions for Case I and Case II. Experimental data are shown with standard deviation error bars.
Processes 08 01195 g002aProcesses 08 01195 g002b
Figure 3. Network maps of central carbon metabolism. Network fluxes were determined for Case I (left) and Case II (right) where the network illustrates the optimal solution from flux balance analysis (FBA). Note that the scales, as indicated in the legends, are different for Case I and Case II.
Processes 08 01195 g003
Figure 4. Network maps of amino acid and sulfur metabolism. Network fluxes were determined for Case I (left) and Case II (right) where the network illustrates the optimal solution from FBA. Note that the scales, as indicated in the legends, are different for Case I and Case II.
Processes 08 01195 g004
Figure 5. Flux spans for Group I fluxes for the optimal production of aroma impact fluxes represent conditions Case I where uptake fluxes are constrained based on experimental data ((a), top) and unconstrained conditions ((b), bottom). Bars depict the possible range (minimum and maximum) fluxes (mmol gDW−1 h−1) and dot indicates the average flux calculated by flux variability analysis (FVA) for reactions.
Processes 08 01195 g005
Table 1. Significant higher alcohols or alcohol Coenzyme As (CoAs) and respective esters relevant to wine aromas.
Alcohol/Alcohol CoAEsterOrganoleptic PropertiesPresent in Existing Model (iMM904)
Ethanol Ethyl acetateFruity; solvent-like Yes
1-PropanolPropyl acetateFruity; sweetNo, newly added
IsoamylolIsoamyl acetate Banana; pear Yes
IsobutanolIsobutyl acetate Fruity; sweetYes
2-Phenyl ethanol2-Phenylethyl acetate Roses; honey; sweet Yes
TyrosolTyrosyl acetateFloral; fruityNo, newly added
MethionolMethionyl acetateSulfurous; cabbage; herbalNo, newly added
Hexa-1-ol Hexyl acetate Sweet; grape-likeNo, newly added
Butanoyl-CoA Ethyl butanoateBanana; pineappleNo, newly added
Hexanoyl-CoA Ethyl hexanoate Aniseed; apple No, newly added
Butanoyl-CoA Ethyl butanoateBanana; pineappleNo, newly added
Decanoyl-CoA Ethyl decanoate Waxy; fruity; sweet; appleNo, newly added

